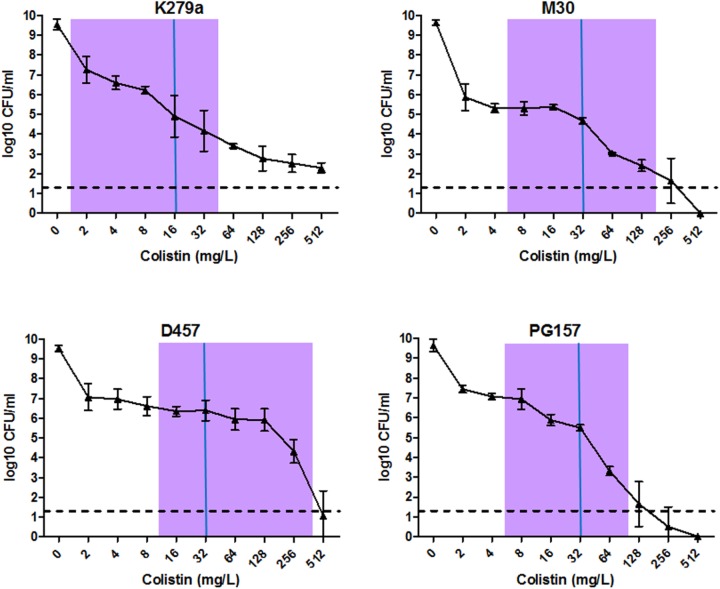
FIGURE 3.
Analysis of hetero-resistant subpopulations of selected S. maltophilia isolates by population analysis profile (PAP). PAP was determined at 24 h by agar dilution of cultures exposed to serial dilutions of colistin. The y axis indicates the number of colonies on MHA plates, and concentrations of colistin are shown on the x axis. Values are means of three or four replicate experiments with SD. The limit of counting was 20 CFU/ml, and it is indicated with a horizontal dashed line. For each strain, MIC value calculated by the BMD method is indicated with a solid vertical blue line and a purple bar indicates the resazurin-stained transition zone.

