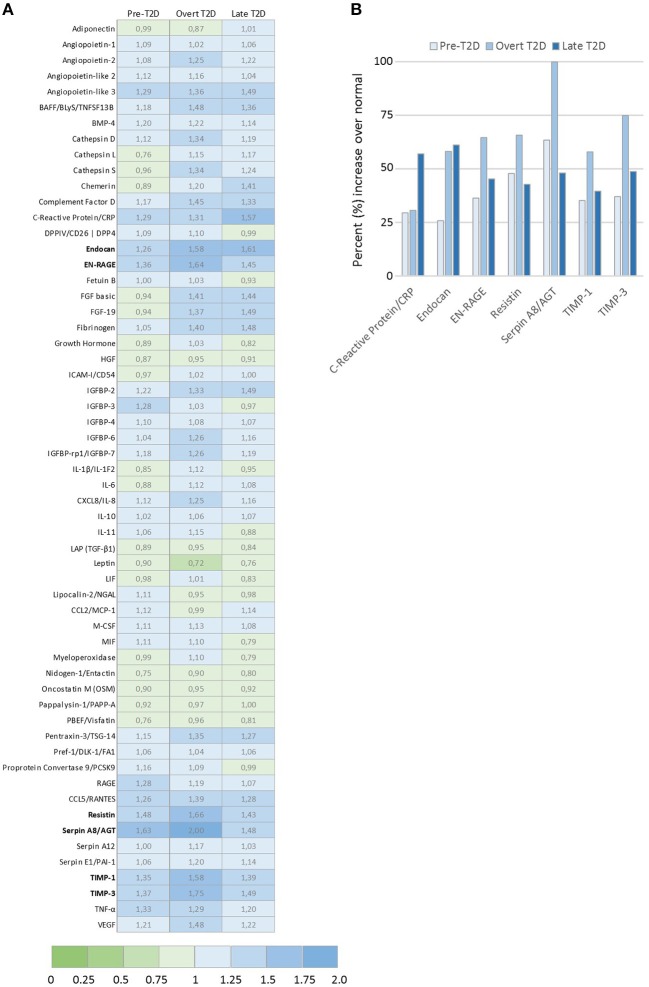
Figure 4.
Adipokine proteome profile analysis of relative levels of 58 secreted adipokines by 3T3-L1 adipocytes. (A) Graph shows the top modulated adipokines by 3T3-L1 adipocytes cultured under obesity-associated metabolic conditions Pre-T2D, overt T2D, or late T2D, with ≥ 50% increase relative to normal (low glucose/low insulin) metabolic conditions. (B) Ratio of relative expression levels of the 58 individual adipokines secreted by 3T3-L1 adipocytes cultured under pre-T2D, overt T2D or late T2D metabolic conditions compared with normal. Relative adipokine levels in normal metabolic conditions = 1, increased levels (>1.0; blue), decreased levels (<1.0; green) compared with normal.

