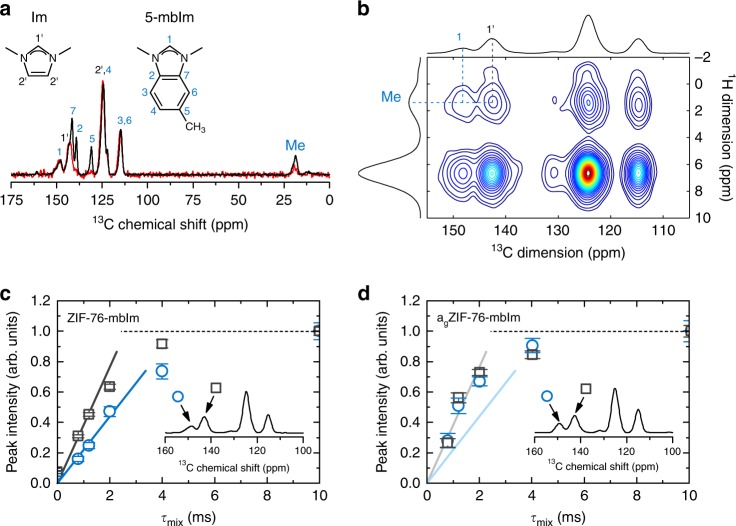
Fig. 2.
Linker dynamics upon melting. a The 13C MAS (black solid line) and 1H-13C Lee–Goldburg cross-polarization MAS (red solid line) NMR spectra of crystalline ZIF-76-mbIm. Tentative assignment of individual signals is based on literature data for isotropic chemical shifts from the two molecular fragments. The assignment is further confirmed by comparing the resonances in the 13C MAS and 1H-13C Lee–Goldburg cross-polarization MAS NMR spectra. In the latter, only resonances belonging to those carbons with hydrogens attached can be observed. b The 13C-detected 2D spin-diffusion NMR spectrum, recorded with a mixing time of 10 ms. Cross peaks due to polarization transfer between methyl protons of 5-mbIm on one hand and H1’ protons of Im and H1 protons of 5-mbIm on the other are denoted. c, d Spin-diffusion curves from the 13C-detected measurements on ZIF-76-mbIm and agZIF-76-mbIm (squares: inter-linker polarization transfer between methyl protons of 5-mbIm and H1’ protons of Im; circles: intra-linker polarization transfer between methyl and H1 protons of 5-mbIm). Solid lines in c and d indicate the initial slopes of the two spin-diffusion curves for crystalline ZIF-76-mbIm (i.e., lines in d are equal to lines in c)

