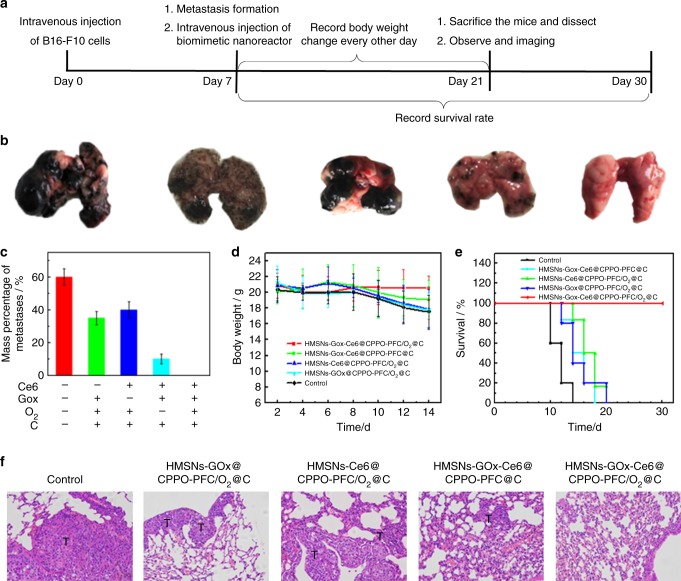
Fig. 5.
Therapeutic effects of the bio-NRs in vivo. a Schematic illustration of the in vivo therapeutic process. b Macroscopic images of lungs receiving different treatments. From left to right: control, HMSNs-GOx@CPPO-PFC/O2@C, HMSNs-Ce6@CPPO-PFC/O2@C, HMSNs-GOx-Ce6@CPPO-PFC@C, and HMSNs-GOx-Ce6@CPPO-PFC/O2@C. c The mass percentage of metastases. Mass percentage of metastases/% = weight of metastatic tumors/weight of normal lung. d Body weight curves of mice with metastatic tumors in each group. e Survival rates for each group after receiving treatments. f H&E staining of lung-bearing metastatic tumors after different treatments (×200, scale bars are 100 μm). T= tumor

