Figure 3.

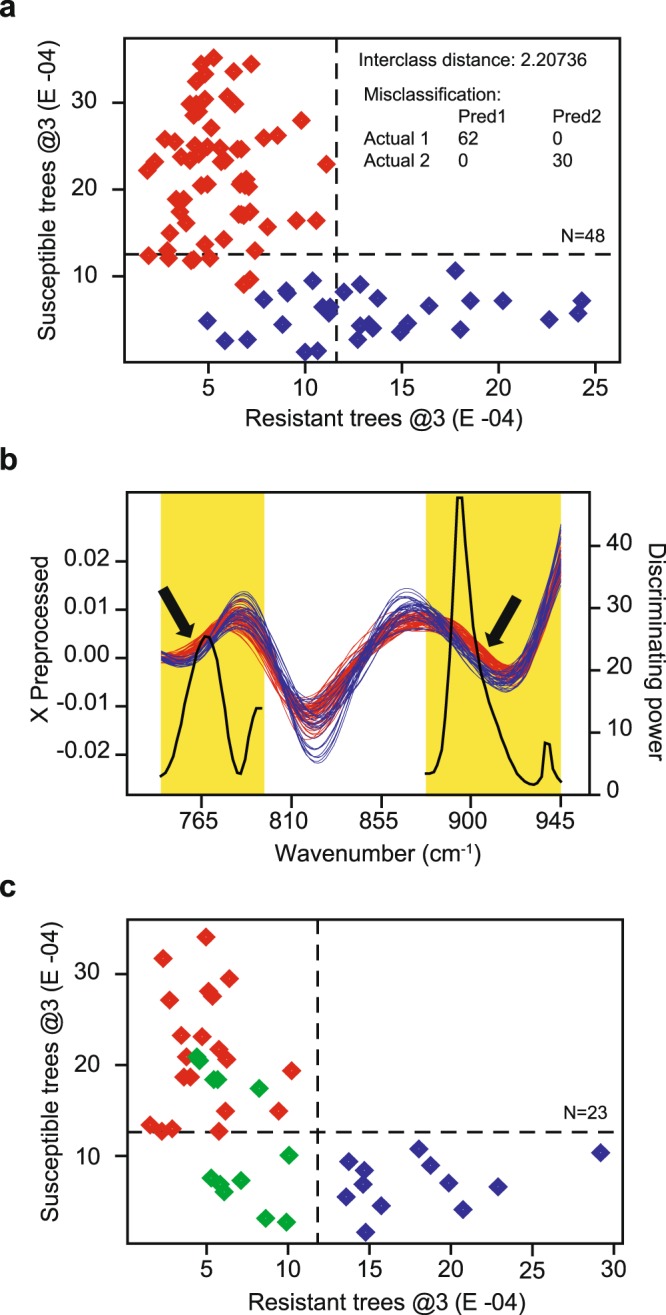
SIMCA Coomans plots and discriminating power plot. Panel a, SIMCA Coomans plot showing the relative, dimension-free distance between the samples of the training data set used to build the 3-factor (@3) calibration model designed to discriminate between ash dieback resistant (red diamonds) and susceptible (blue diamonds) Fraxinus excelsior trees. X-axis represents the distance from the resistant class, while y-axis represents the distance from the susceptible class. Two technical replicates were analysed separately, for a total of 92 spectra, corresponding to 48 biological replicates. Dashed lines indicate critical sample residual thresholds. Panel b, SIMCA discriminating power plot of the 3-factor calibration model. The discriminating power (black line) is overlaid on the second derivative, smoothed and standard normal variate transformed spectra. The SIMCA calibration model that best discriminated between resistant (red lines) and susceptible (blue lines) ash trees included spectral regions from ~748 to 798 cm−1 and from ~879 to 947 cm−1 wavenumber (highlighted in yellow). The black arrows point to regions of the spectra where the discrimination between the two resistance phenotypes is evident by visual inspection. Panel c, SIMCA Coomans plot showing the relative, dimension-free distance between the samples of the testing data set used to validate the 3-factor (@3) model. In addition to resistant (red diamonds) and susceptible (blue diamonds) trees, the testing data set included accessions of intermediate phenotype (green diamonds), based on field observations. Two technical replicates were analysed separately, for a total of 44 spectra, corresponding to 23 biological replicates randomly selected from each of the six European countries. Dashed lines indicate critical sample residual thresholds.
