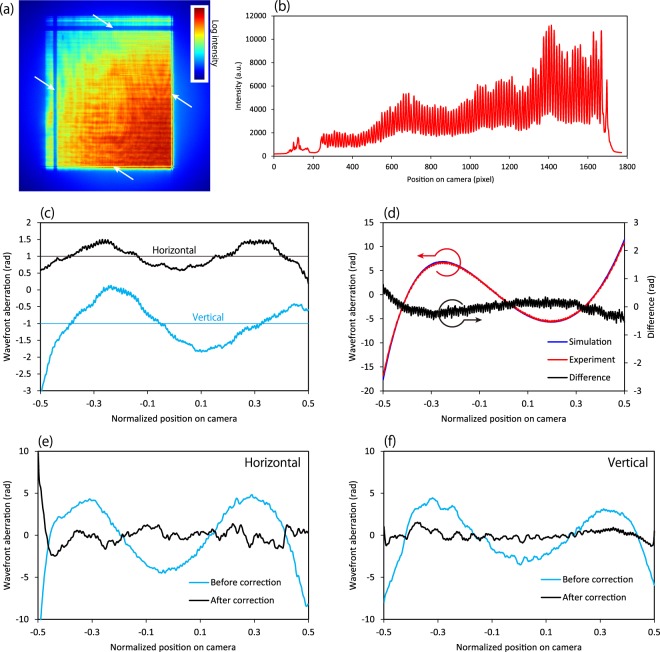
Figure 3.
Wavefront measurements obtained using a single-grating interferometer. (a) Typical recorded self-image and (b) its cross-sectional profile. The white arrows in (a) indicated the uncoated area on the mirrors, used as position references in order to convert the wavefront data to shape error data. (c) Systematic errors induced by the camera. (d) Wavefront aberrations after introducing known comatic aberration by inclining the vertical focusing mirror by 10 μrad. The red and blue lines are the experimentally obtained results and those calculated using the Fresnel–Kirchhoff integral. The black line is the difference between the experimental and calculated results. (e,f) Wavefront aberrations obtained before and after direct shape correction. The term “normalized position on camera” in the graphs means the normalized position on the camera with respect to the effective bright field width, where the dimensions of the bright field at a camera length of 0.82 m were 16.4 × 19.4 mm2 (H × V).

