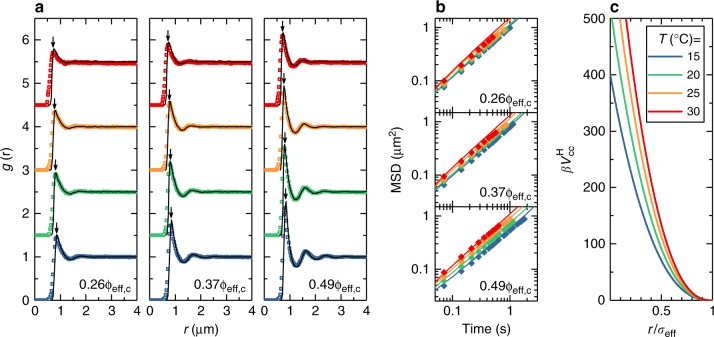
Fig. 1.
Temperature-dependent structure, dynamics and interaction potential of one-component microgel suspensions. Symbols indicate experimental data, solid lines represent simulations. Color legend applies to all panels. a Radial distribution functions g(r) from simulations and experiments. Panels show data for and 0.49 (left to right, evaluated at T=15°C) for 15°C ≤ T ≤ 30 °C. Graphs are offset along the y-axis for clarity. Downward pointing arrows indicate the hydrodynamic diameter of colloids at each T. b MSDs for 15 °C ≤ T ≤ 30 °C reconstructed from the x,y trajectories, i.e. 〈x2 + y2〉, with and 0.49 (from top to bottom). c Hertzian interaction potential at different temperatures: Ucc = 400, 520, 640, 760kBT for T = 15, 20, 25, 30 °C respectively. The distance is rescaled by σeff = 2RH

