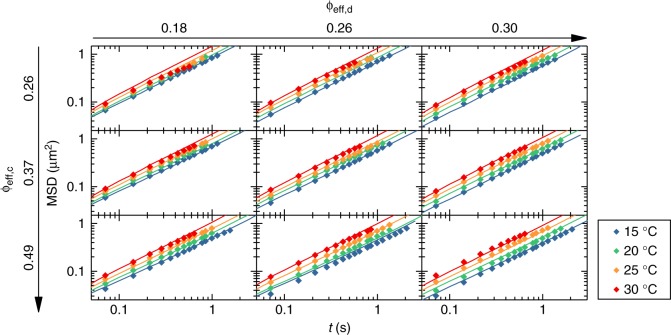
Fig. 4.
Experimental and numerical mean square displacements for all investigated state points. Diamonds denote 2D experimental data (〈x2 + y2〉), while solid lines represent the corresponding simulation results based on the MH model. The color legend applies to the entire graph. Values of ϕeff,c and ϕeff,d at 15 °C are given for each row and column, respectively. For higher temperatures, the values of ϕeff,c,ϕeff,d can be found in Table 1

