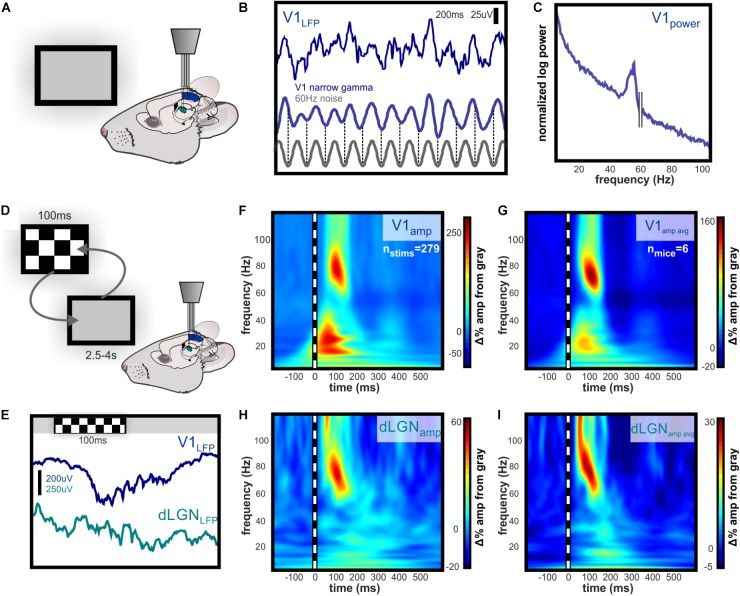
FIGURE 1.
Evoked narrowband and broadband high gamma oscillations dLGN and V1. Independently guided electrodes were used to record LFP and spikes from L4 of V1 and dLGN during visual stimulation. (A) Illustration of experimental setup during baseline recording of activity evoked by viewing of the gray computer screen. (B) Example of 200 ms of raw narrowband gamma in L4 of V1 evoked by luminance of a gray computer screen. The frequency is between 50 and 60 Hz, but ambient 60 Hz electrical noise is not linked to this oscillation, as illustrated by the phase shifts near the beginning and end of trace. (C) Spectral power of narrowband gamma oscillation in V1. Peak in spectral power is apparent below 60 Hz. (D) Illustration of experimental setup during randomized presentation of high contrast checkerboard image. (E) Example raw LFP in V1 and dLGN during single checkerboard presentation. Contrast-evoked oscillations are higher in amplitude and wider in bandwidth than narrowband gamma in V1, and are also visible in dLGN. (F) Example time-frequency analysis of contrast-evoked LFP oscillations in V1, normalized to amplitude during gray screen viewing. 100 ms checkerboard image evokes high amplitude oscillations in distinct low and high gamma frequency ranges. (G) Group mean change in oscillation amplitude over time relative to LFP during gray screen viewing. Peak amplitude change occurs in the 50–90 Hz range 100–125 ms after stimulus onset. (H,I) Same as (F,G) for LFP in dLGN. Low gamma amplitude is not contrast-modulated in dLGN, and high gamma amplitude reaches near-maximal value before V1.

