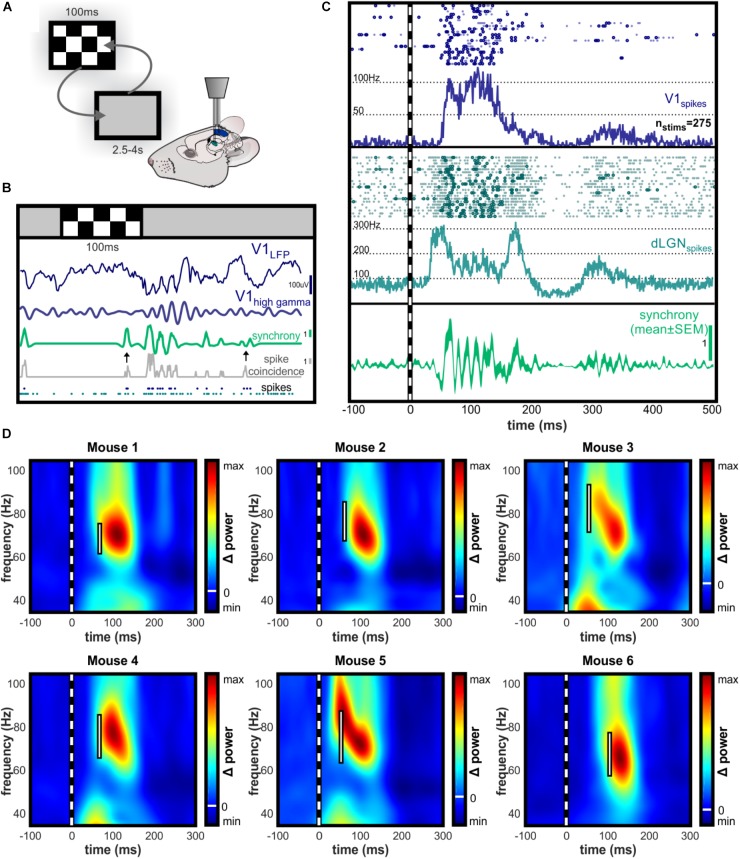
FIGURE 3.
Time-resolved spike synchrony is rhythmic in the high gamma range. (A) Illustration of experimental setup during randomized presentation of high contrast checkerboard image. (B) Single trial example of dLGN-V1 spike synchrony and V1 LFP following checkerboard stimulus. Synchronous bursts of spikes are observed following presentation of the checkerboard image, which align with the gamma oscillation observed in V1. Gray trace represents the number of dLGN-V1 spike coincidences within a sliding 4.5 ms window. Green trace represents time-resolved spike synchrony, which is taken from the coincidence rate and adjusted for spike rate using spike-time jittering (see Section “Materials and Methods” for details). Scale bar shows height of 1 coincidence above mean probability for the concurrent spike rate within the jittering time window (±10 ms). Note the two black arrows indicating moments of equal spike coincidence, but high (left) versus low (right) spike synchrony values after the jitter correction is applied. This highlights the sensitivity of the method to the precise alignment of spikes rather than increases in spike rate. (C) Example raster plot for V1 and dLGN spikes occurring in 20 consecutive trials, and peri-stimulus histogram over all trials. Dark circles in raster plot highlight spikes occurring synchronously above the chance probability for the concurrent spike rate. After initial dLGN burst and V1 response, dLGN spikes appear to be modulated at an approximate 68 Hz rhythm. Bottom panel shows synchrony function averaged over trials to reveal rhythmicity of synchronous spikes locked to the stimulus onset. (D) Peak amplitude of high gamma oscillations in V1 LFP occurs following the peak of rhythmic spike synchronization in the same frequency range. Individual examples of contrast-evoked gamma oscillations with latency and bandwidth of peak spike synchrony superimposed. White bar spans the bandwidth of 95% maximal amplitude of rhythmic spike synchrony. All color axes are normalized to maximum amplitude increase and decrease with white line indicating zero amplitude change.

