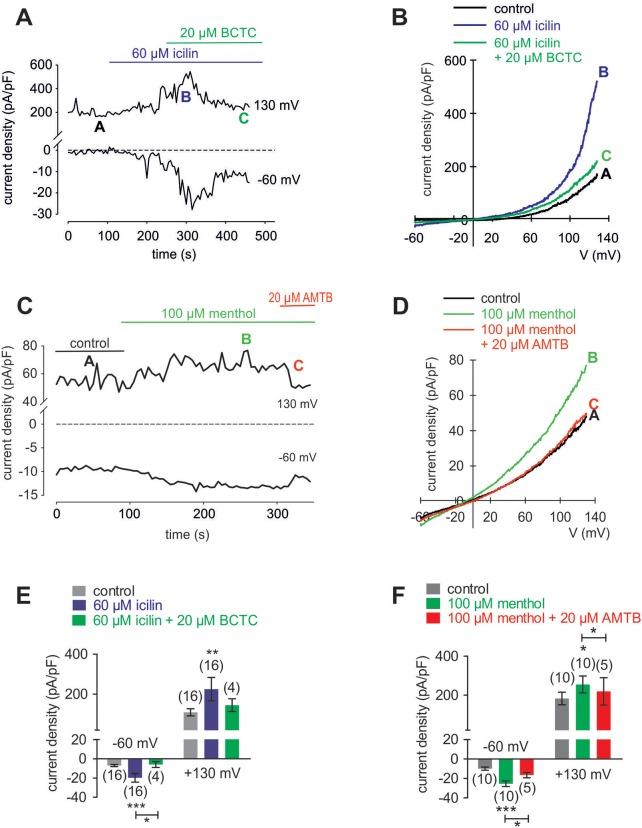
Figure 9.
Menthol and icilin activated whole-cell currents in HCK. (A) Time course recording showing the current increases induced by icilin (60 μM) and declines after application of 20 μM BCTC. (B) Original traces of icilin-induced current responses to voltage ramps. Current densities are shown before application (labeled as A), during application of 60 μM icilin (labeled as B), and after addition of 20 μM BCTC (labeled as C). Current densities as function of voltage were derived from the traces shown in (A). (C) Time course recording showing the current increases induced by menthol (100 μM) and declines after application of 20 μM AMTB. (D) Original traces of menthol-induced current responses to voltage ramps. Current densities are shown before application (labeled as A), during application of 100 μM menthol (labeled as B), and after addition of 20 μM AMTB (labeled as C). Current densities as function of voltage were derived from the traces shown in (C). (E) Summary of patch-clamp experiments with icilin and BCTC. The asterisks (*) indicate statistically significant differences between in- and outward whole-cell currents with and without icilin (n = 16; p < 0.001; paired tested) and significant difference of inward currents between icilin with and without BCTC (n = 4; p < 0.05; unpaired tested). (F) Summary of patch-clamp experiments with menthol and AMTB. The asterisks (*) indicate statistically significant differences of in- and outward whole-cell currents with and without menthol (n = 10; p < 0.001; paired tested) and significant difference of inward currents between menthol with and without AMTB (n = 5; p < 0.05; paired tested).

