Figure 1.
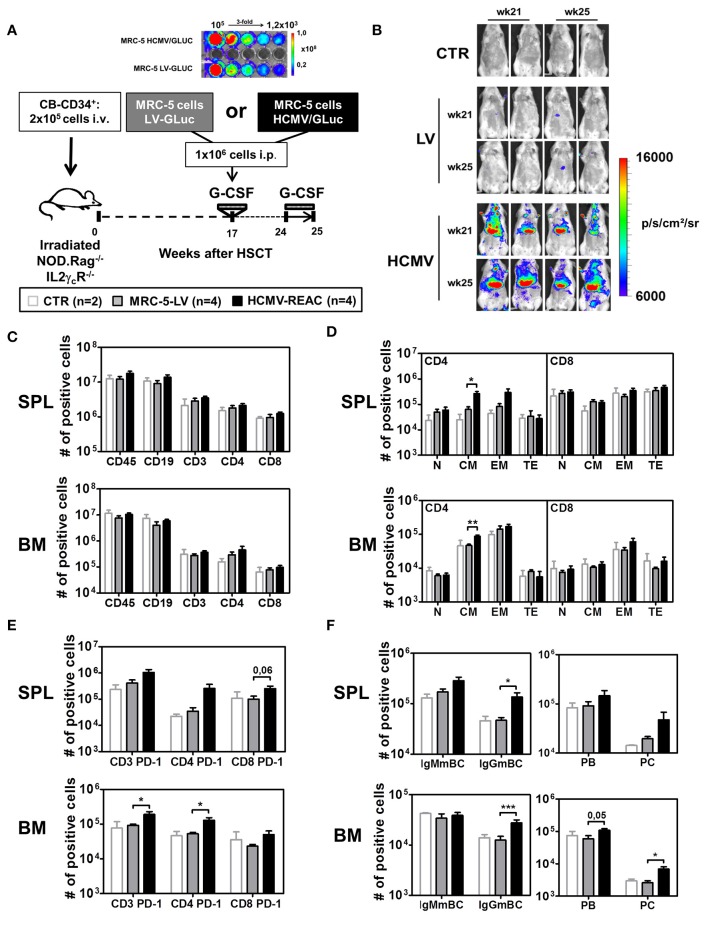
Infection of NRG mice with mock MRC-5 and HCMV-MRC-5 cells followed by stimulation with hG-CSF. (A) Schematic representation of experiment 2. MRC-5 transduced with LV-GLuc and MRC-5 infected with HCMV-GLuc showing comparable bio-luminescence signal by optical imaging analyses. As a control group (CTR), irradiated NOD.Rag−/−IL2γcR−/− (NRG) mice were transplanted with CD34+ CB-HSCT and maintained for 25 weeks. At week 17 after HSCT, experimental groups were treated with hG-CSF (150 ng/mouse/day s.c.) for 5 days and injected i.p. with 1 × 10⁶ MRC-5-LV-GLuc cells (LV) or with MRC-5-HCMV-GLuc cells (HCMV); at week 24 after HSCT they were treated for 7 days with hG-CSF (2.5 μg/mouse/day s.c.). (B) Optical imaging analyses performed at weeks 21 and 25 after HSCT showing bio-luminescence signals on different body parts of MRC-5-HCMV-GLuc injected mice (scale bar depicts the average radiance as p/s/cm2/sr). (C) Quantified total cell numbers (# of positive cells) of human cells recovered from SPL and BM: huCD45+ cells within all lymphocytes or CD19+ B cells, CD3+, CD4+, and CD8+ T cells within huCD45+ cells. Bar graphs represent CTR (white bars), LV (gray bars), and HCMV (black bars) mice. (D) Total cell numbers (# of positive cells) are shown for CD4+ T cells (left) and CD8+ T cells (right) for different subtypes (N, CM, EM, TE) for SPL (top) and BM (bottom). (E) Total cell numbers (# of positive cells) for PD-1 expression on CD3+, CD4+, and CD8+ T cells in SPL (top) and BM (bottom). (F) Analysis of B cell maturation showing IgMmBC, IgGmBC (left, IgM+, and IgG+ memory B cells), PB, and PC (right, plasmablasts, and plasma cells) for SPL (top) and BM (bottom). Statistics were performed with unpaired T-test comparing MRC-5-LV and HCMV-REAC (* < 0.05; ** < 0.01; *** < 0.001).

