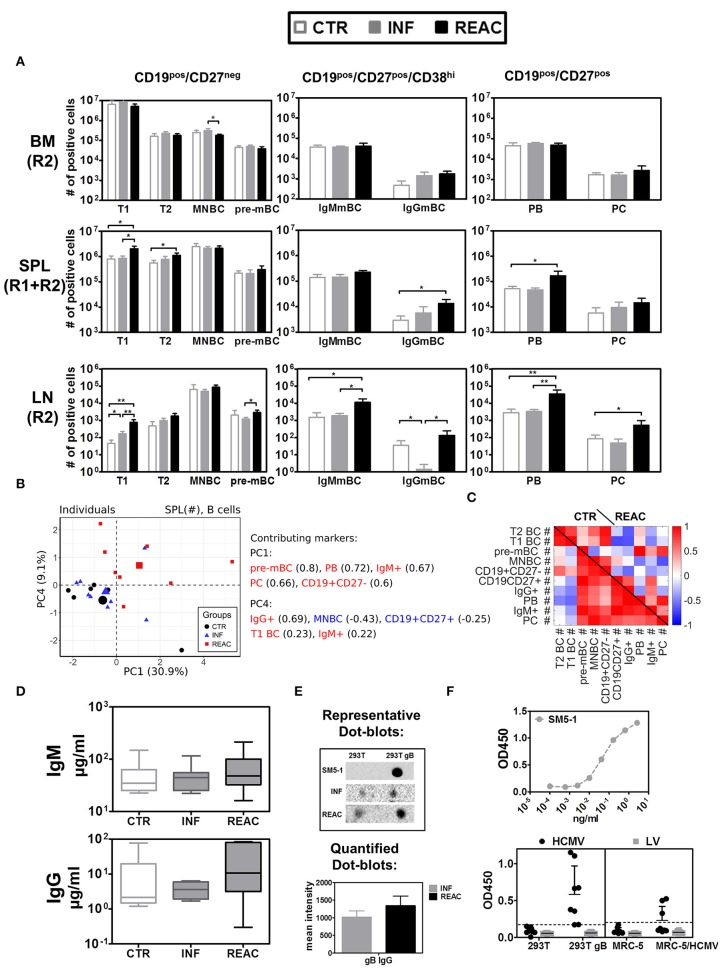
Figure 5.
Differentiation of B cell subsets and class switch after HCMV infections and reactivations with HCMV specific IgG response. (A) Total cell counts (# of positive cells) are shown for B cells obtained from control (CTR, white bars), infected (INF, gray bars), or reactivated (REAC, black bars) cohorts in different tissues: LN (R2), SPL (R1+R2), and BM (R2). Error bars indicate standard error of the mean. Negative binomial-regression model was applied for statistical analysis (* < 0.05; ** < 0.01). (B) Similar PCA and correlation analyses to Figures 4B,C is shown for B cell associated markers with absolute numbers (#) in SPL. (B,C) PCA performed with B cell-associated markers consisting of absolute numbers (#) in SPL was performed according to the materials and methods. (B) Similar analysis as Figures 4B,D was performed and the individual measurements are shown according to their values in PC1 and PC4. (C) Similar correlation analysis as Figures 4C,E is presented in the form of heat-map for CTR and REAC groups. (D) Total human IgM and IgG (μg/ml) measured in plasma by ELISA for CTR (n = 7), INF (n = 7), and REAC (n = 7) cohorts. (E) Dot-blot assays. Plasma from HCMV infected mice was tested for reactivity against HCMV-gB based on cell extracts of 293T-w.t. and 293T-gB cells loaded as dot-blot on membranes which were exposed to plasma and secondary antibody and developed by chemiluminescence analyses. The mean intensity combining the results obtained for INF (n = 7) and REAC (n = 7) mice is shown. SM5-1 is human monoclonal antibody against gB used as a positive control. Plasma of CTR mice showed no signal. (F) ELISA assay performed with mouse plasma. ELISA plates were coated with cell extracts generated with 293T, 293T-gB, MRC-5, and MRC-5 infected with HCMV cells. Upper panel: Serial dilutions of the SM5-1 antibody was used as a reference in ELISA plates coated with 293TgB extracts. Lower panels: 1/10 diluted plasma samples obtained from humanized mice administered with MRC-5 cells infected with HCMV/GLuc (HCMV-REAC) or administered with MRC-5 cells infected with LV/GLuc (MRC-5-LV) (Exp. 2) were used. Reactivity of the antibodies were measured in the ELISA assay for absorbance and depicted as OD450. Each data point represents results obtained for individual mice of the HCMV-REAC (n = 4) or MRC-5 LV (n = 4) cohort. Error bars indicate standard deviation. Hatched line depicts the background signal of the assay.

