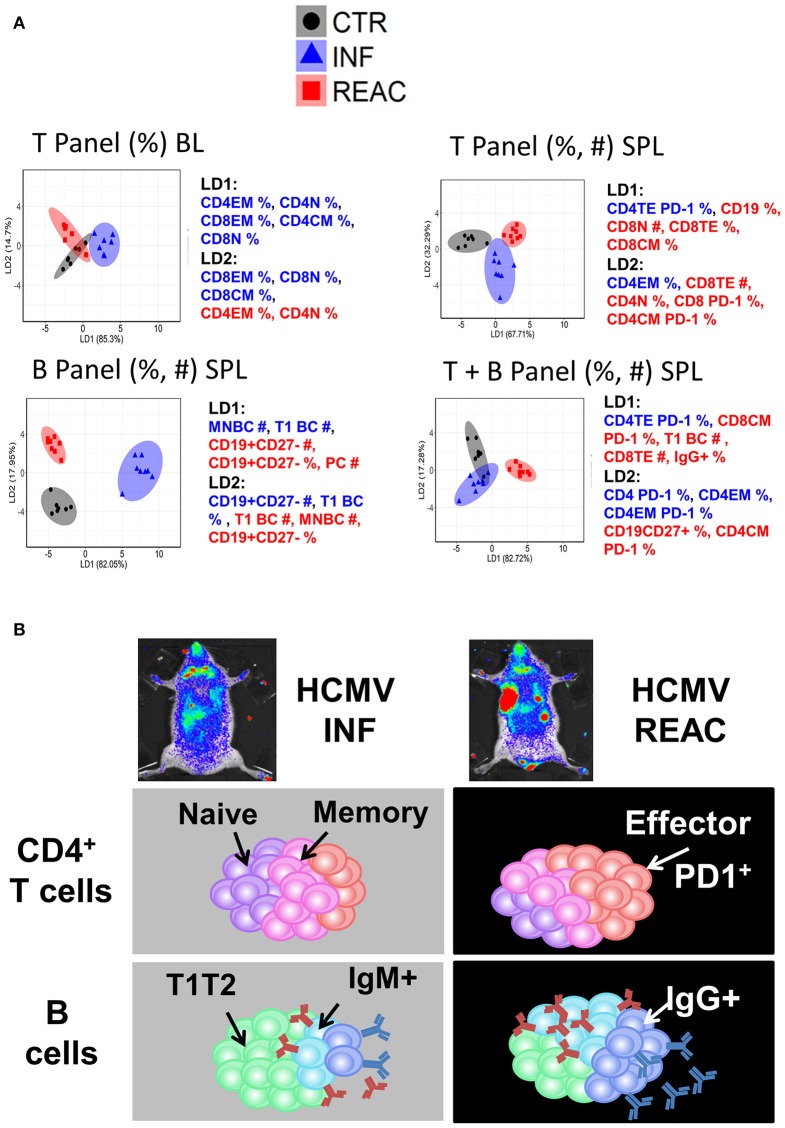
Figure 6.
Distinctive immunologic signatures observed in humanized mice after HCMV infections and reactivations. (A) LDA performed with panels of immune phenotypic markers (frequencies % and absolute numbers #) used to characterize T and/or B cells measured in blood (BL) and spleen (SPL). The clusters show CTR in gray, INF in blue, and REAC in red. The axes represent the percentage separation achieved by each discriminant function (LD1, LD2) according to a “proportion of trace.” The top 5 markers with highest contributions (highest absolute coefficients) in the composition of discriminant functions are shown. Markers with negative and positive contributions are annotated in blue and red, respectively. (B) Schematic representation of the data explaining the model: Relative to the control group, infections promoted the development of memory CD4+ T cells whereas reactivations were strongly associated with expansion of effector CD4+ PD-1+ T cells and development of IgG+ mature B cells.

