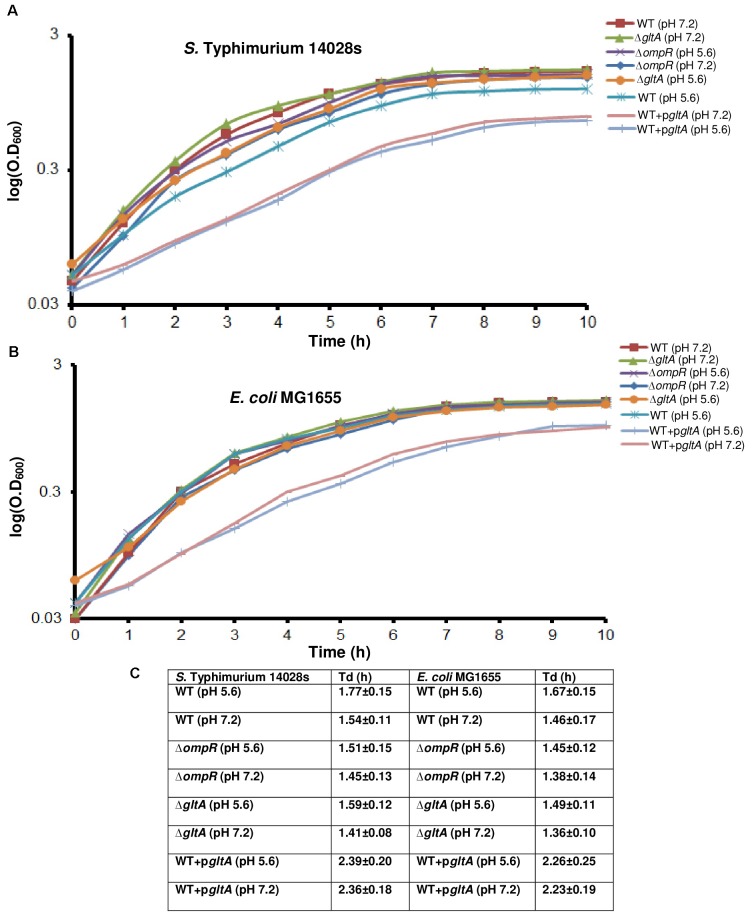
FIGURE 1.
The effect of acid pH on growth curves of S. Typhimurium and E. coli. Wild-type, an ompR null mutant, a gltA null mutant and a gltA over-expressed strain of (A) Overnight cultures of S. Typhimurium and (B) E. coli grown in LB were sub-cultured (1:100) in MgM pH 7.2 for 24 h. The cultures were then sub-cultured again (1:50) in MgM pH 5.6 or pH 7.2 for an additional 10 h as described in Materials and Methods. The optical density at 600 nm (O.D.600) was measured hourly to monitor bacterial growth (n = 3). Strains in which gltA was over-expressed exhibited growth defects at neutral and acid pH compared to the wild-type and ompR null strains in both S. Typhimurium and E. coli. The error bars were removed to make the graphs legible. (C) The doubling time (Td) was plotted as determined from the exponential curve fitting function as described in Materials and Methods. Error bars represent the mean ± standard deviation (n = 3).

