
FIGURE 3.
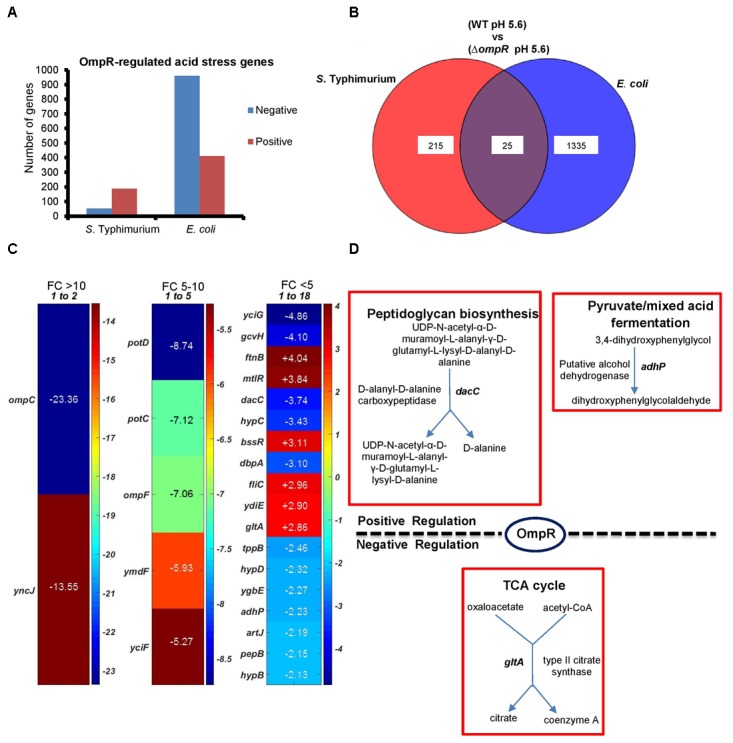
Comparison of the ompR acid stress regulons of S. Typhimurium and E. coli (A) The number of OmpR regulated genes (≥ 2-fold change; P-value ≤ 0.05) in S. Typhimurium and E. coli are shown in response to acid stress. (B) Overlap of OmpR acid stress targets between S. Typhimurium and E. coli. (C) A heat map shows the differential expression profiles of common OmpR targets separated into three groups based on the fold change, i.e., ompC was the most highly downregulated-regulated gene at –23.36. A positive number indicates OmpR repression. The fold change represents the expression level of an ompR null strain compared to the wild-type in S. Typhimurium or E. coli during acid stress. The color scale represents the average fold change (n = 3). Supplementary Table S2 provides a detailed description of the overlapping genes. Data processing was performed using MATLAB 6.1 (MathWorks Inc., Natick, MA, United States). (D) Enzymatic reactions and pathways of the common OmpR targets involved in metabolism are shown using PGDB analysis (EcoSal Plus doi: 10.1128/ecosalplus.ESP-0009-2014). Similar algorithms and software tools were used for the remaining microarray analyses.