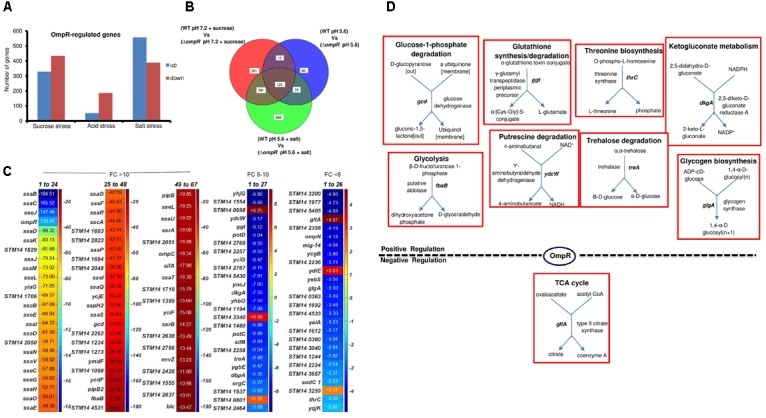
FIGURE 8.

Overlapping OmpR acid, sucrose, and salt stress targets (A) Statistically significant (≥ 2-fold change; P-value ≤ 0.05) OmpR targets differentially expressed in S. Typhimurium in response to acid, sucrose and salt stress are shown. (B) Overlapping OmpR targets are shown. (C) A heat map shows the expression profiles of the overlapping OmpR-regulated genes grouped based on differences in their fold change. The color scale represents the average fold change of an ompR null strain during sucrose stress (n = 3). (D) Metabolic overview of OmpR targets involved in cellular processes is shown.
