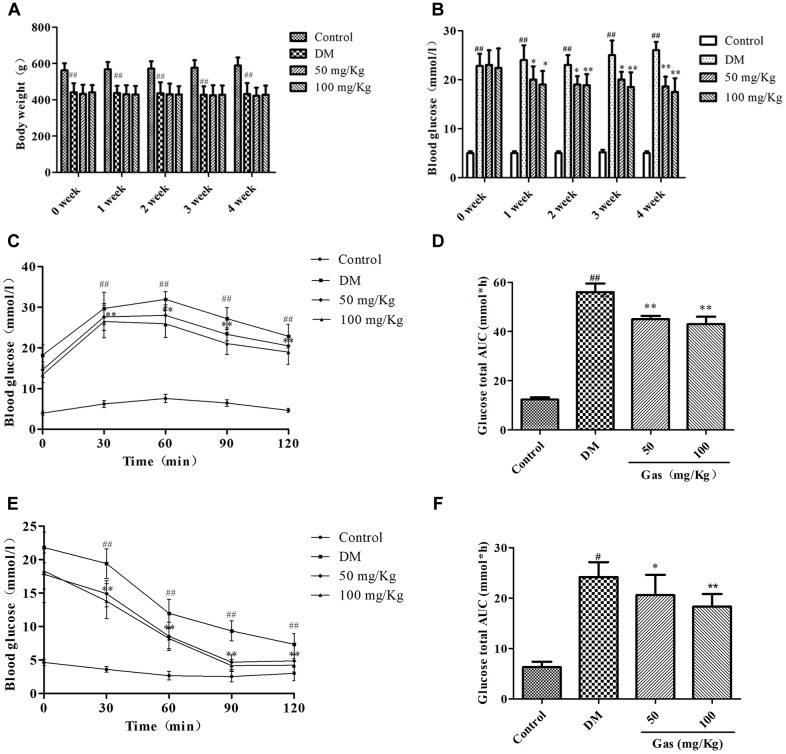
FIGURE 3.
Gas improves insulin resistance in DM rats. (A) Body weight of rats in each group during 5 weeks of treatment. (B) Fasted blood glucose level of rats in each group during 5 weeks of treatment. (C) Curve of blood glucose level in OGTTs. (D) Glucose total AUC in OGTTs. (E) Curve of blood glucose level in ITTs. (F) Glucose total AUC in ITTs. All data are expressed as means ± SD for 10 rats in each group. #P < 0.05,##P < 0.01, compared with the control group. ∗P < 0.05, ∗∗P < 0.01, compared with the DM group.

