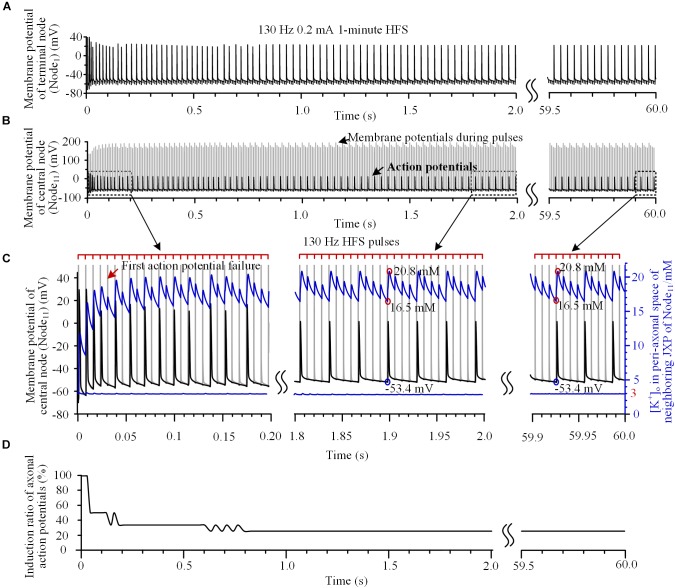
FIGURE 2.
Action potentials and [K+]o induced by high-frequency stimulation (HFS). (A,B) Membrane potentials recorded simultaneously at the end node (Node1) and the central node (Node11) during a 1-min train of 130 Hz pulse stimulation with 0.2 mA intensity. For clarity, recordings in 2.0 ∼ 59.5 s are omitted. (C) Magnified plots of membrane potentials at Node11 (black curves), [K+]o at Node11 (blue curves below) and [K+]o in the peri-axonal space of neighboring JXP (blue curves up) during the first 0.2 s, middle 1.8 ∼ 2.0 s and last 0.1 s of the 1-min HFS. Cathodic monophasic pulses of extracellular HFS are represented by the tick marks on the red lines above. The gray curves in (B,C) represent changes of membrane potentials induced by pulses at Node11. These large potentials are trimmed in the enlarged plots in (C). (D) Change of induction ratio of axonal action potentials by pulses of HFS.

