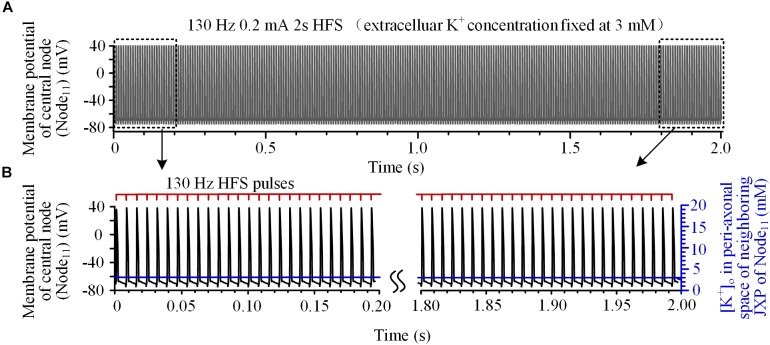
FIGURE 3.
Axonal responses during high-frequency stimulation (HFS) when the extracellular K+ concentration was fixed at 3 mM: (A) Action potentials induced by 130 Hz pulses during 2-s HFS. (B) Membrane potential at Node11 (black curves) and [K+]o in the peri-axonal space of neighboring JXP (blue curves) during the first and last 0.2 s of the 2-s HFS shown in (A). Every stimulation pulse induces an action potential.

