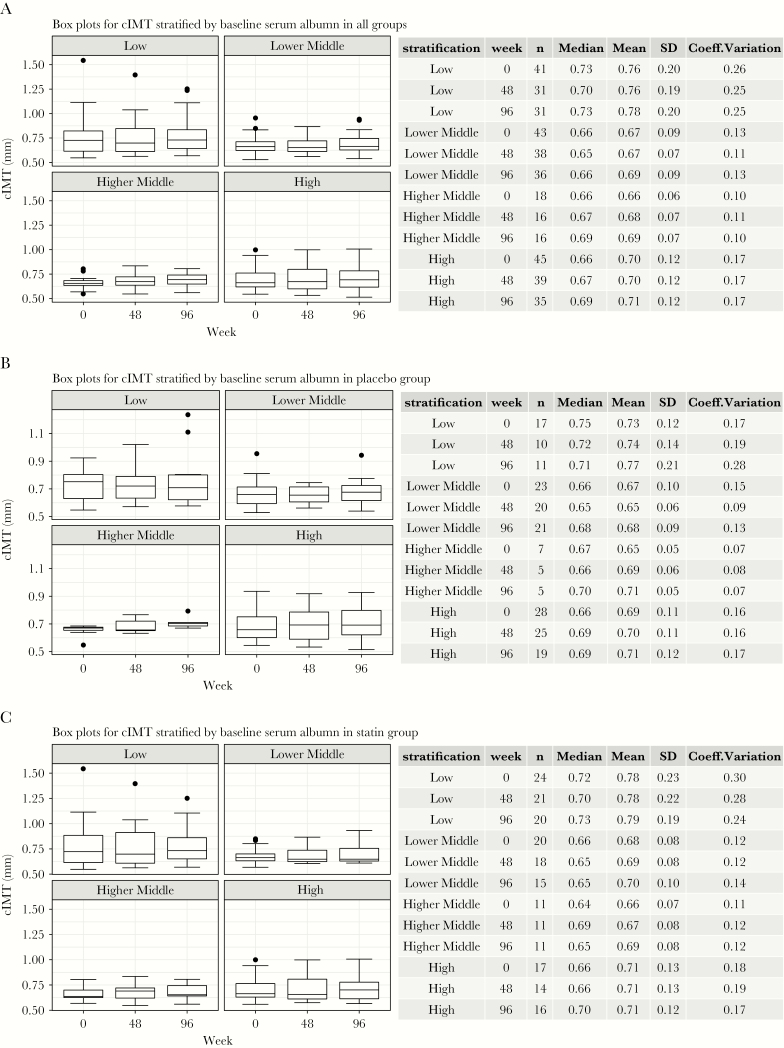
Figure 2.
Carotid intima media thickness (cIMT) stratified by serum albumin at each study time point and by randomization group. (a) Box plots for cIMT stratified by baseline serum albumin levels in all groups. (b) Box plots for cIMT stratified by baseline serum albumin levels in the placebo group. (c) Box plots for cIMT stratified by baseline serum albumin levels in the statin group. Box plots representing median values with whiskers representing the upper and lower quartiles.

