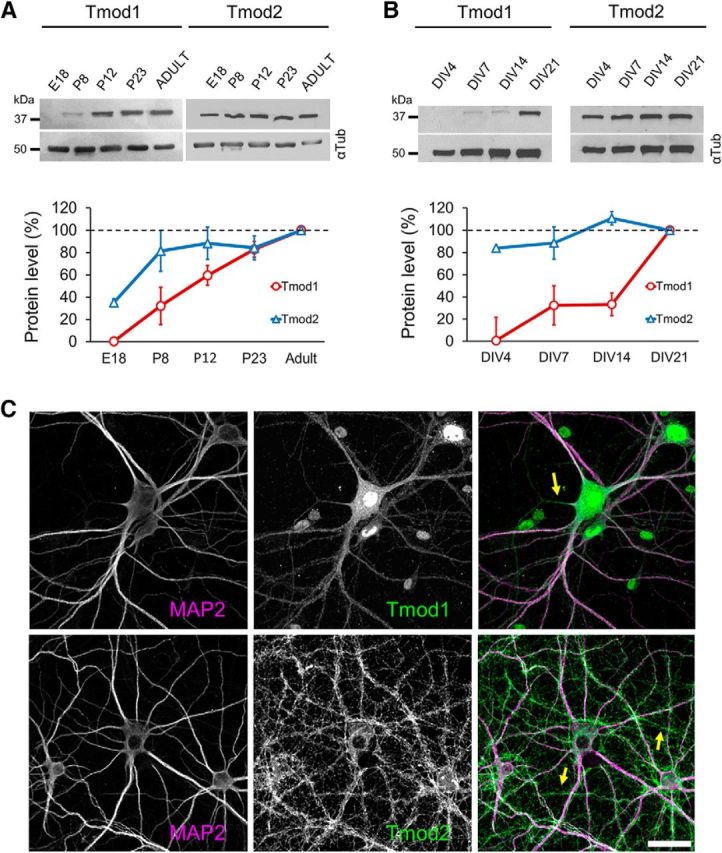
Figure 1.

Expression of Tmod1 and Tmod2. A, B, Representative Western blots of Tmod1 and Tmod2 in rat hippocampal tissue (A) and primary hippocampal neurons (B) depict the changes in Tmod expression over time. All bands in gel are cropped for clarity. Quantification from three separate replicates is shown in the corresponding line graphs (N = 3 for each time point). The mean value for each time point was normalized to the corresponding tubulin loading control (αTub), and then to the “Adult” (A) or “DIV21” (B) value. C, Immunostaining of endogenous Tmod1 and Tmod2 (green), together MAP2 (magenta) in DIV21 cultured hippocampal neurons. Arrows indicate axons. Scale bar, 30 μm.
