Figure 2.
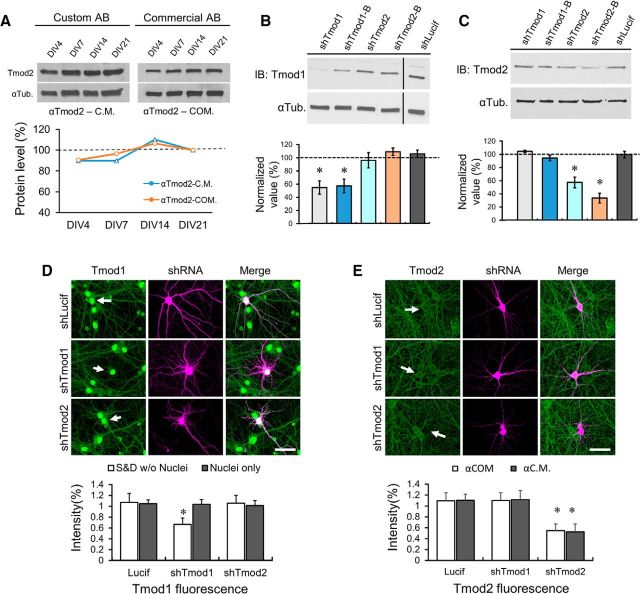
Antibody specificity and shRNA knockdown of endogenous Tmods. A, Representative immunoblot depicting levels of endogenous Tmod2 expression in primary hippocampal neurons, as detected using αTmod2-C.M., which has been previously verified for specificity (Fowler et al., 1993), and αTmod2-COM, which was used throughout this study. The corresponding line graph from the immunoblots is shown below. The value for each time point was normalized to the corresponding tubulin loading control (αTub), and then to the DIV21 value. B, C, Representative immunoblot images reveal robust and specific reduction of Tmod1 and Tmod2 protein levels in CAD neuroblastoma cells expressing knock-down constructs (48 h). Black vertical bar in Tmod1 blot (left) delineates the boundary between two nonadjacent lanes from the same gel (processed identically). All bands in gel are cropped for clarity. Bar graphs depict mean Tmod1 (B) and Tmod2 (C) knockdown levels in CAD cells from three independent replicates. Data are normalized to Tmod protein levels in shLucif-expressing cells. Statistical analysis was performed using an unpaired Student's t test. Error bars represent the SEM. *Statistical difference from the control. For immunoblotting (IB): Tmod1: t(df) = 2.44(6), pshTmod1 = 2.5E-3, pshTmod1-B = 1.6E-4; Tmod2: t(df) = 2.78(4), pshTmod2 = 6.8E-3, pshTmod2-B = 0.023. D, E, Immunostaining of endogenous Tmod1 (D) and Tmod2 (E) by custom and commercial antibodies in DIV21 cultured hippocampal neurons expressing shLucif, shTmod1, or shTmod2. Neurons were transfected at DIV13 and imaged at DIV21. Statistical analysis was performed using an unpaired Student's t test comparing the mean Tmod1 or Tmod2 fluorescence intensity to that of neighboring nontransfected cells (control) in the same field of view. Error bars represent SEM. Tmod1 fluorescence: t(df) = 2.00(59), pshTmod1 = 3.36E-15; Tmod2 fluorescence: t(df) = 2.02(38), pshTmod2αC.M. = 2.03E-16, t(df) = 1.97(66), pshTmod2αCOM = 1.64E-24. Arrows depict transfected neurons. S&D, somatodendritic; αCOM, αTmod2-COM; αC.M., αTmod2-C.M. Scale bar, 35 μm.

