Figure 3.

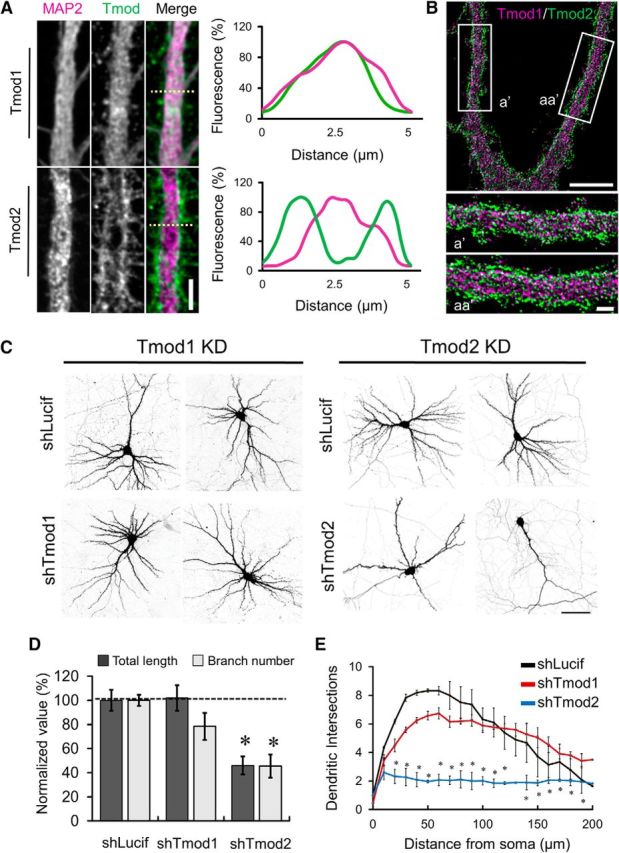
Regulation of dendrite development by Tmod. A, Representative confocal immunofluorescence images of dendritic regions in neurons stained for Tmod1 or Tmod2 and MAP2. Scale bar, 4.5 μm. Right, Representative line profiles from regions in corresponding images (dashed line). B, Representative STED images of dendrites from DIV21 hippocampal neurons costained with Tmod1 and Tmod2. Scale bar: top, 5 μm; bottom, 1 μm. C, Representative confocal images of DIV21 neurons expressing shLucif, shTmod1, or shTmod2. Images were inverted in grayscale for presentation. D, Bar graph shows changes in total dendritic length and branch number, as labeled. For each condition, values are normalized to shLucif. Error bars represent SEM. *Statistical significance using an unpaired, Student's t test. ShTmod2: t(df) = 2.22(10), ptotal length = 9.43E-4, t(df) = 2.26(9), pbranch number = 5.0E-4. E, Line graph depicts the results of Sholl analysis from control, shTmod1-expressing, and shTmod2-expressing neurons. Statistical analysis was performed using a two-way ANOVA with a Dunn's multiple-comparison test to determine statistical differences. *Statistical significance compared with shLucif. Tmod2: F(DFn, DFd) = F(2,105) = 137.2, p20–130 μm = 0.0002, 0.0001, 0.0001, 0.0001, 0.0001, 0.0001, 0.0001, 0.0001, 0.0001, 0.0001, 0.0026, and 0.407. Error bars represent the SEM.
