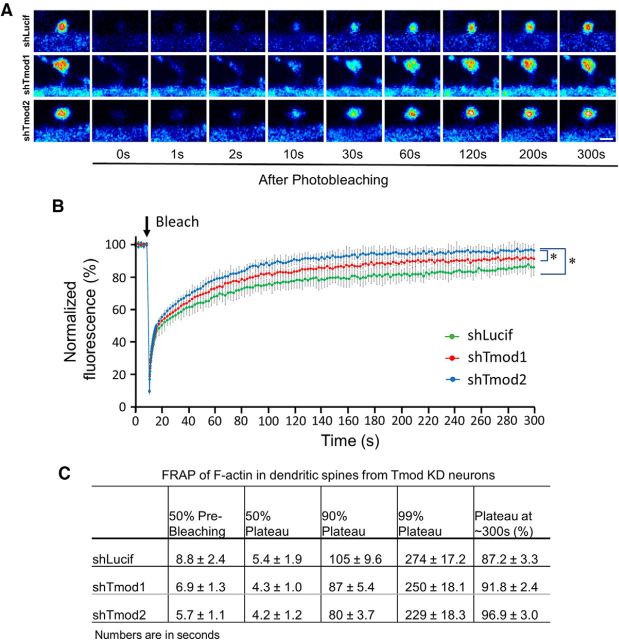
Figure 6.
FRAP analysis of spine actin turnover in Tmod1 or Tmod2 knock-down (KD) neurons. A, Representative image sequences showing the fluorescence recovery of EGFP-actin after single-spine photobleaching in neurons expressing shLucif, shTmod1, or shTmod2. Scale bar, 1 μm. B, FRAP curves for control or shTmod-expressing neurons. The fluorescent signals in spines are normalized to the prebleaching mean and corrected for acquisition-based bleaching using the signals from the adjacent shaft regions. N = 15, 24, and 20 for shLucif, shTmod1, or shTmod2 groups, respectively. Error bars represent the SD. *Statistical difference from the control (shLucif). Unpaired Student's t test was performed selectively, and only the statistical results on data at 100, 200, and 300 s are shown here. For shTmod1: t(df) = 2.03(37), p = 3.85E-09, 9.73E-11, and 6.79E-07; shTmod2: t(df) = 2.03(33), p = 5.34E-14, 1.66E-13, and 3.90E-10. C, Quantification table showing the EGFP-actin recovery time for 50% prebleaching levels, 50% plateau levels, 90% and 99% plateau levels, and the final recovery percentages in dendritic spines. Results are shown as the mean ± SEM.

