Figure 8.

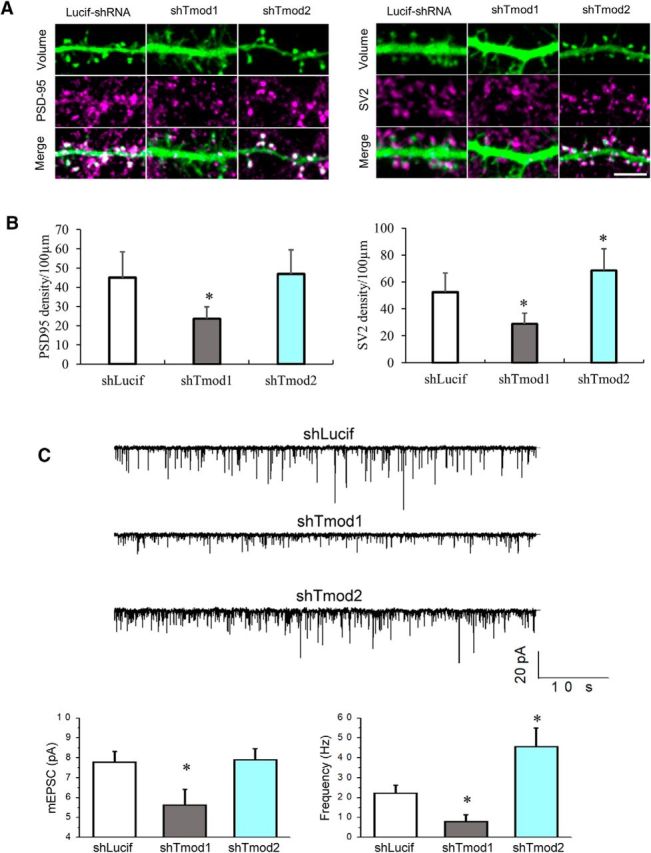
Tmod1 loss impairs synapse formation. A, shLucif and shTmod1 or shTmod2 neurons were stained for PSD-95 (left) and SV2 (right). Scale bar, 5 μm. B, Bar graphs depict changes in the density of PSD-95 and SV2 in knock-down and control groups (shLucif). Statistical analysis was performed using an unpaired Student's t test. *Statistical difference from the control. For PSD95: t(df) = 2.01(47), pshTmod1 = 4.31E-09; SV2: t(df) = 2.01(45), pshTmod1 = 2.53E-08, 2.02(44), pshTmod2 = 0.001. C, mEPSCs in DIV21 hippocampal neurons transfected with shLucif, shTmod1, and shTmod2. Each group contains at least five cells from two to three batches of cell culture. Sample traces are shown in the top portion and the bar graphs depict the average mEPSC amplitude and frequency. *Statistical difference from the shLucif group using unpaired Student's t test. For mEPSC amplitude: t(df) = 2.18(12), pshTmod1 = 0.04, pshTmod2 = 0.89; mEPSC frequency: t(df) = 2.18(12), pshTmod1 = 0.04, pshTmod2 = 0.02.
