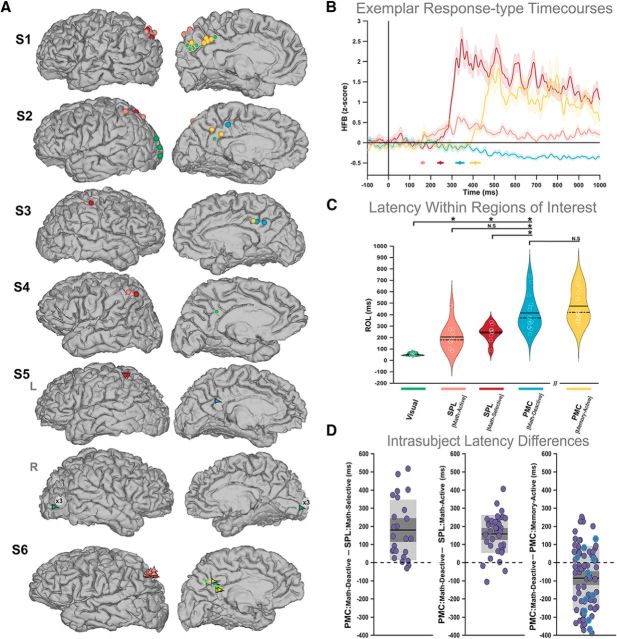
Figure 2.
Spatiotemporal distribution of memory and math responses in parietal and visual cortices. A, Lateral and medial views of electrode positions on subject-specific brain masks. Electrode colors represent specific functional response types as shown in Figure 1. Visually active electrodes are shown in green for two pertinent subjects (S2 and S5). Note that six visually active contacts were found in the right hemisphere for S5 and their equivalent trajectory is denoted on each cortical view with a single green arrow. B, Average (across trials) HFB time courses for four exemplar contacts from a single subject (S1), representing each response type in the lateral and medial parietal cortex. The shaded area denotes the SEM across trials for each condition. The colored circles below the responses denote the ROL estimates for those signals, while their corresponding horizontal lines indicate the 95% confidence interval across bootstrap iterations (see Materials and Methods). Importantly ROL values were estimated as the median across bootstrapped trials and, therefore, do not directly characterize the average signals displayed. C, ROL values for ROI-specific responses. The width of violin plots represents kernel density, and white circles denote individual data points. The violin plot representing memory-active sites is spatially separated (along the x-axis) to distinguish these temporal findings from those acquired during the math condition. D, ROL differences calculated within-subjects between distinct response types. Across comparisons, shaded dark gray indicates SEM, shaded light gray denotes SD, the black line demarcates the mean across difference values, and the dotted line distinguishes the zero value. For the last comparison (far right), we indicate differences for responses within the same electrode (i.e., those showing both a memory activation and a math deactivation) with a blue edge.

