. 2018 Nov 16;8:592. doi: 10.7916/D8864094

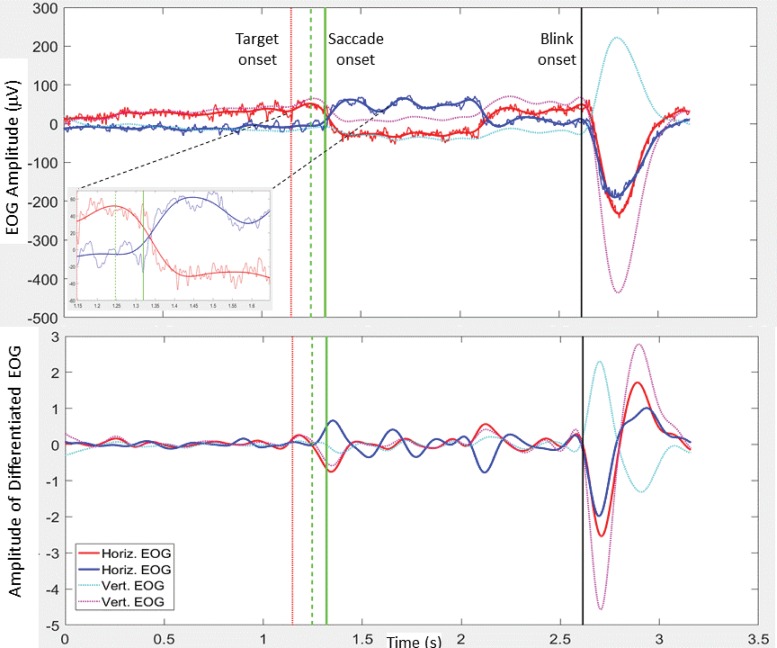
Figure 1. Electro‐oculography (EOG) Data from a Sample Leftward Trial. (A) The smoothed (0.2–6 Hz) and higher resolution (0.2–125 Hz) EOG is shown for the right (red) and left (blue) signals. Smoothed vertical EOG is also shown (dotted). The onset of the fixation cross occurs at zero (start of trial). The red dotted vertical lines represent target onset and the black vertical line represents blink onset/trial end. The solid vertical green line marks saccade onset. The dashed vertical green line just prior to saccade onset marks the initial estimate of saccade onset. The inset shows magnified horizontal EOG (both smoothed and high definition) from target onset to 0.5 seconds after target onset. Again saccade onset and initial saccade onset are indicated by vertical lines. (B) The differentiated horizontal and vertical smoothed EOG, with vertical lines as above. See explanations in text.

Figure 1