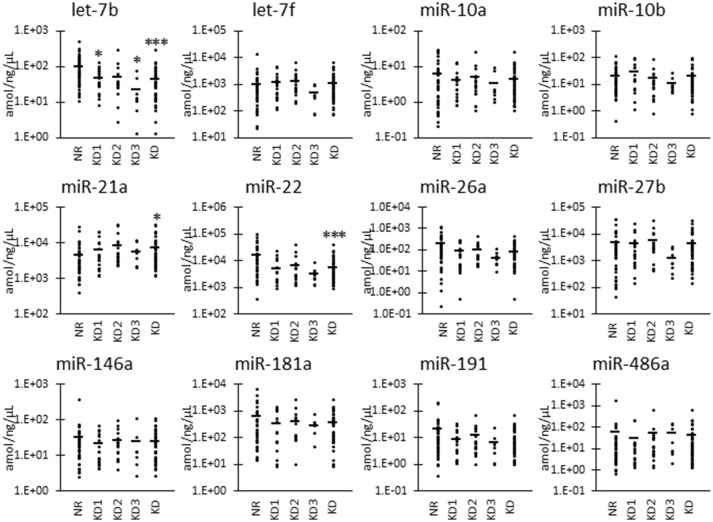
Figure 3.
miRNA levels normalized to urinary total RNA level in urinary exosome-derived miRNA in cats. Cats were divided into the normal renal function group (NR, blood urea nitrogen (BUN) = 12.8–29.8 mg/dL, serum creatinine (sCRE) = 0.4–1.5 mg/dL, n = 43) and kidney disease group (KD, BUN = 30.1–140.0 mg/dL, sCRE = 1.8–14.0 mg/dL, n = 45). Furthermore, based on serum creatinine levels, the KD group was divided into three groups including KD1 (1.6–2.8 mg/dL), KD2 (2.9–5.0 mg/dL), and KD3 (5.0> mg/dL). Kruskal-Wallis test was used for comparing the three populations or time points, and multiple comparisons were performed using Dunnett's test when a significant difference was observed (*, ***: P < 0.05, 0.001). TaqMan PCR method. Bars in graphs show the mean of each group.

