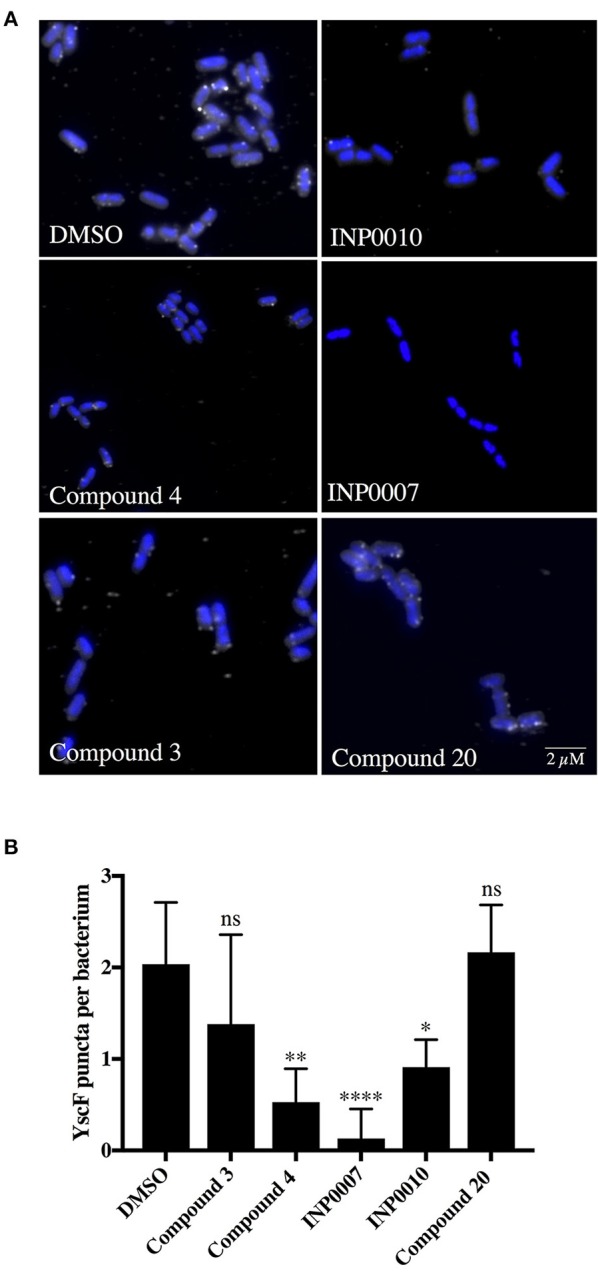
Figure 6.

YscF puncta visualization in Y. pseudotuberculosis using immunofluorescence. Wildtype Y. pseudotuberculosis was grown under T3SS-inducing conditions for 3 h in 50 μM compound or equivalent volume of DMSO and an anti-YscF antibody used to visualize T3SS needles. (A) Representative confocal microscopy images and (B) the average number of YscF puncta per bacterium from three biological replicates ± the standard deviation are shown, with N > 1,500 bacteria quantified per condition. Statistical significance is represented comparing compounds relative to the DMSO control. ****P < 0.0001, **P < 0.002, *P < 0.04 (one way ANOVA with Dunnett's post-hoc test).
