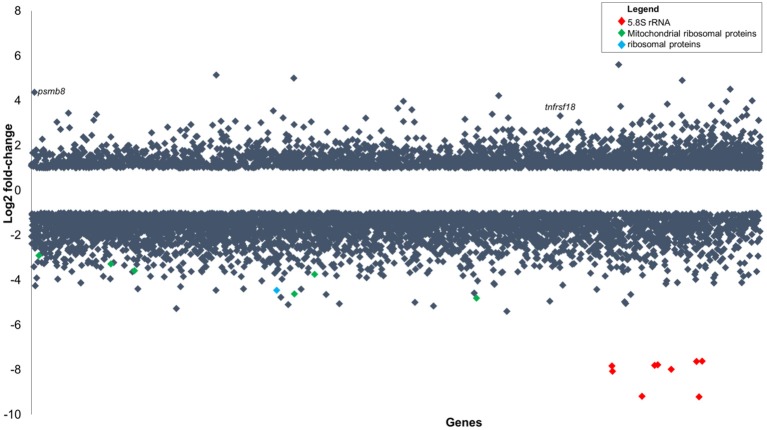
Figure 5.
Gene expression changes in zebrafish embryos (log2 fold-change) infected with P. aeruginosa PASS1 compared to zebrafish embryos injected with phosphate buffered saline. Each dot represents a gene within the zebrafish genome (x-axis) and its fold-change (log2) expression 3 dpi (p ≤ 0.01 and log2 fold-changes cut-off −1≥ to ≤1).

