Figure 2.
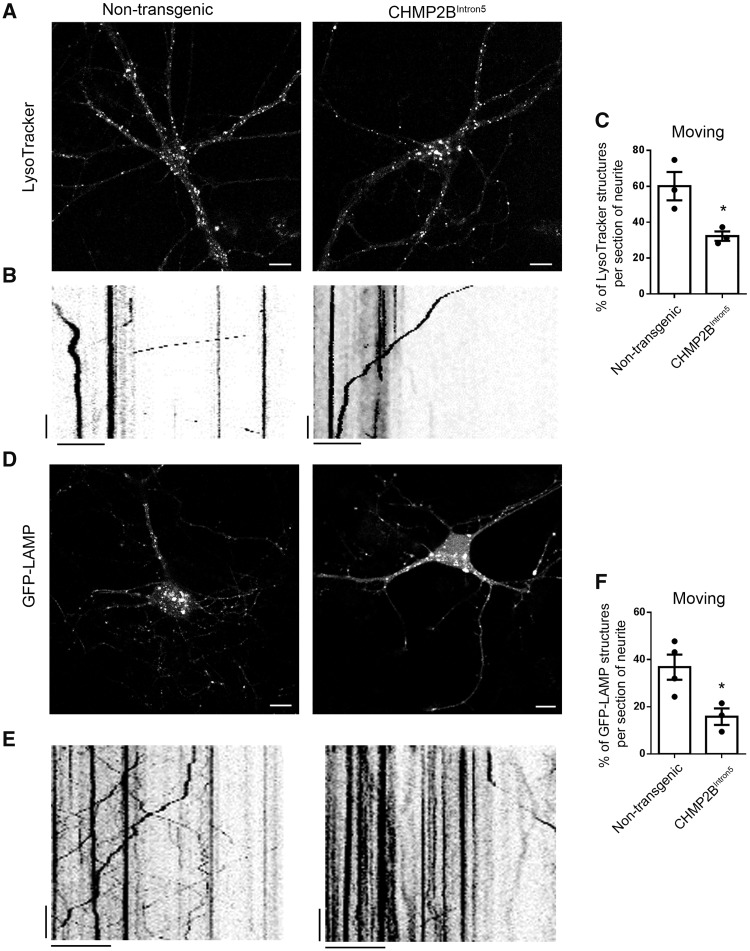
Mutant CHMP2B decreases endolysosomal trafficking. (A) Representative images of LysoTracker® labelled control and mutant CHMP2B cultures. Scale bar = 10 µm. (B) Example kymographs from 50 µm sections of dendrite labelled with LysoTracker® and imaged for 120 s. Vertical scale bar = 20 s, horizontal scale bar = 10 µm. (C) Quantification of moving and stationary LysoTracker® structures from kymographs. n = 3, with three to five neurons per n, DIV 12–20 cortical cultures. (D) Representative images of GFP-LAMP transfected control and mutant CHMP2B cortical cultures. Scale bar = 10 µm. (E) Kymographs from sections of dendrite labelled with GFP-LAMP and live cell imaged for 120 s. Vertical scale bar = 20 s, horizontal scale bar = 10 µm. (F) Quantification of moving and stationary GFP-LAMP structures from kymographs. n = 3 for mutant CHMP2B, n = 4 for non-transgenic with four to seven neurons per n, DIV 10–14 cortical cultures. Unpaired t-test, *P < 0.05.

