Figure 3.
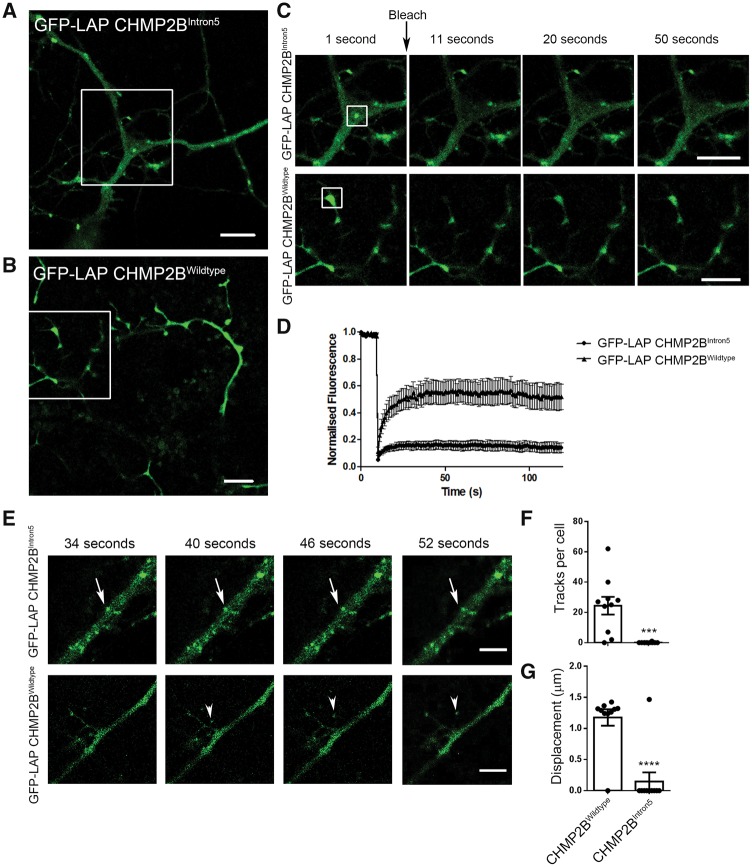
Mutant CHMP2B structures are stationary and show no fluorescence recovery after photobleaching. GFP-LAP tagged mutant (A) or wild-type (B) CHMP2B in DIV 10 primary cortical cultures. (C) Insets from A and B. The structures highlighted by boxes were bleached at the indicated time point, and the recovery of fluorescence followed over time. Representative time points are shown (1, 11, 20 and 50 s). (D) Quantification of the average fluorescence recovery over time for mutant CHMP2B (circles) or wild-type CHMP2B (triangles) normalized to the starting fluorescence. (E) Representative time points of immobile GFP-LAP CHMP2BIntron5 structures (arrows) and moving GFP-LAP CHMP2BWildtype structures (arrowheads). (F) Quantification of the number of traces per transfected cell generated using Trackmate in ImageJ. (G) Quantification of the average displacement of traces automatically generated in ImageJ. n = 10 DIV 10 neurons from two independent experiments. Unpaired t-test, ***P < 0.001, ****P < 0.0001. Scale bars = 5 µm.

