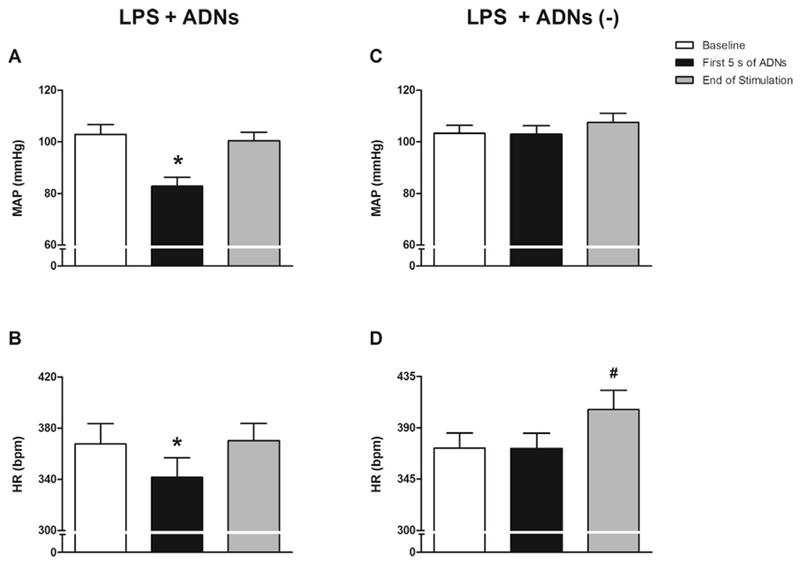
Fig. 2.

Hemodynamic responses to electrical stimulation of the aortic depressor nerve. Bar graphs represent the mean arterial pressure (MAP; A and C) and heart rate (HR; B and D) at baseline; at 5 s after initiating electrical stimulation of the aortic depressor nerve (ADNs), with (LPS + ADNs) or without [LPS + ADNs (–)] hemodynamic changes; and at the end of electrical stimulation (5 s). LPS + ADNs: n = 13; LPS + ADNs (–): n = 12. Bars represent mean ± standard error. *P < .05 vs. baseline; #P < .05 vs. baseline and first 5 s of ADNs.
