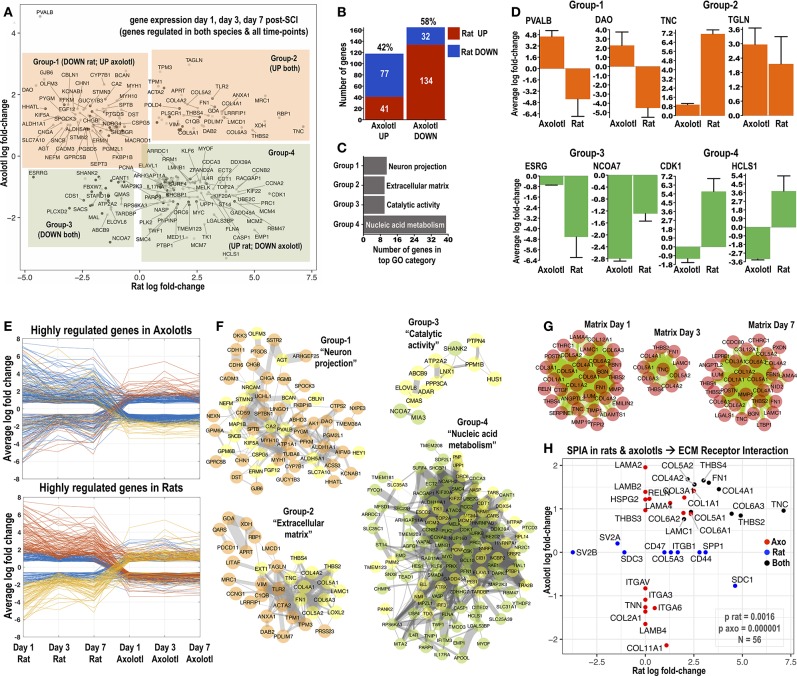
Figure 1.
Identification of common differentially regulated genes in rats and axolotls after SCI. (A) The 4-direction scatter-plot depicts shared differentially regulated genes identified in the rat and axolotl microarray datasets at 1, 3, and 7 days post-SCI. Only significantly altered transcripts were included (all expression data in Supplemental Tables 1–6). Shared differentially regulated transcripts were split into 4 groups according to their log fold-change in rat and axolotl microarrays: Group-1 genes were upregulated in axolotls but downregulated in rats; Group-2 genes were upregulated in both species; Group-3 genes were downregulated in both species and Group-4 genes were upregulated in rats but downregulated in axolotls. Highly differentially regulated genes are labeled. (B) Number and percentage of shared genes from the intersection of rat and axolotl microarrays 1, 3, and 7 days post-SCI and their distribution between the species. (C) The chart summarizes the most overrepresented GO term for Groups 1–4 shown in (A). Full GO enrichment analysis (combining “biological process,” “molecular function,” and “cellular component” categories) was performed with BinGO in Cytoscape. All overrepresented GO terms are summarized in Supplemental Figure 2. Homo Sapiens was used as the reference organism for GO enrichment. (D) The most highly differentially regulated genes from Groups 1–4 and for each species are shown. y-axis is the average log-fold change for each gene for days 1, 3, and 7. Note that for these top regulated genes, gene expression changes in rats are somehow more pronounced than axolotls. (E) Parallel coordinate plots visualize differentially regulated genes in rats and axolotls (cut-off −1.5 and +1.5 log fold-change) and how they change across the species from day 1 to day 7. (F) Protein-protein interaction networks isolating genes that comprise Groups 1–4 from (A). Networks were made using StringDB (Homo Sapiens as the background organism) and visualized in Cytoscape using organic biolayout. Only connected nodes were included and those that did not connect were left out. Thickness of edges is protein-protein interaction probability derived from StringDB (0.15; thinnest to 0.999; widest). Note that low probabilities (0.15–0.40; thin lines) might represent low confidence protein associations not based on physical protein-protein interactions but likely derived from less reliable text-mining data. Yellow nodes highlight genes that belong to the top GO category for each group, which is also indicated. (G) Protein-protein interaction networks depict shared upregulated extracellular matrix transcripts at day 1, day 3, and day 7 post-SCI in rats and axolotls. Note that while 35 matrix genes are upregulated in both species at day 1 and day 7, only 10 are upregulated in both species at day 3 post-SCI (see also Supplemental Figures 1I-K). (H) Signaling pathway impact analysis (SPIA) of consistently differentially regulated genes (days 1, 3, and 7) in rats and axolotls. “ECM Receptor Interaction” was significant in both species post-SCI. The axolotl appears to have a smaller p-value for this pathway given that more matrix proteins are consistently (days 1, 3, and 7) differentially regulated in the regenerating species. The scatter plot displays the 56 genes involved in this pathway and how their average (days 1, 3, and 7) fold-change behaves in the two species (x-axis rat; y-axis axolotl). Red genes are consistently differentially regulated in axolotls but not in rats. Blue are consistently differentially regulated in rats but not in axolotls. Black are regulated consistently in both species. Further SPIA analysis and technical details can be found in Supplemental Figure 3.

