FIGURE 1.
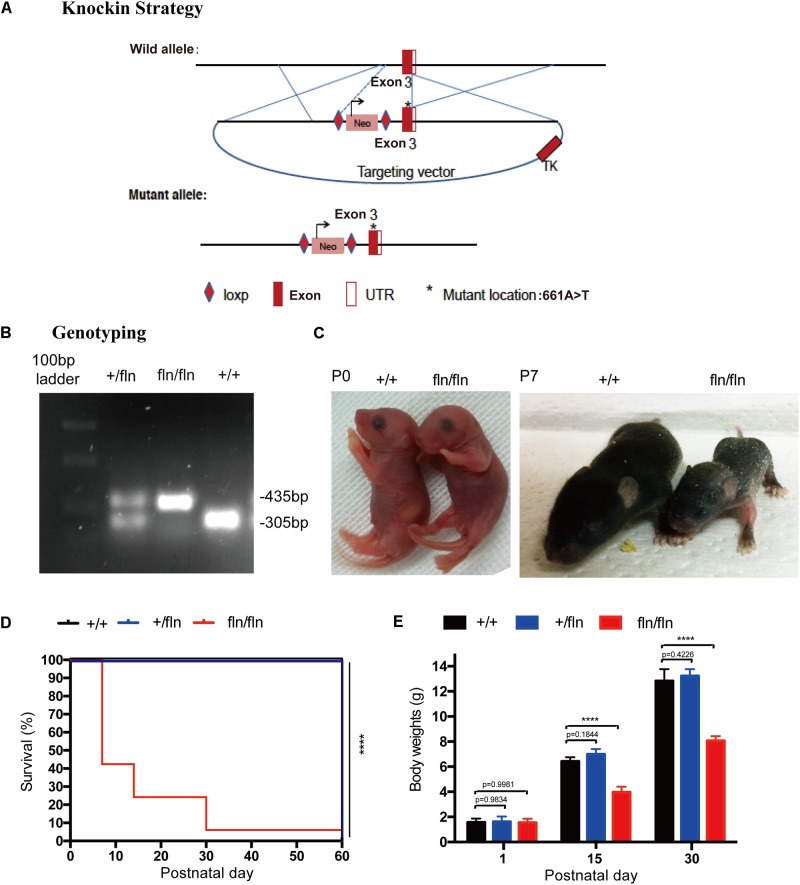
Gene-targeting strategy for generation of NGFR100W knock-in mice model. (A) Diagram illustrating the gene-targeting strategy used to produce the NGFR100W knock-in mice in C57BL/6 background. Starred exon 3 represents the mutated exon harboring the A-to-T mutation at the 661 position. (B) PCR genotyping of wild-type (+/+), the heterozygote (+/fln) and the homozygote (fln/fln): wild-type band: 305 bp, mutant band: 435 bp. (C) fln/fln mice appeared normal at birth (P0), but failed to grow during early postnatal life (e.g., at P7) compared with +/+ littermates. (D) Survival curves for +/+ (n = 20), +/fln (n = 20), and fln/fln (n = 20) mice. fln/fln mice died within 2 months. (E) The body weight growth curves for +/+ (n = 6), +/fln (n = 6), and fln/fln (n = 6) mice. fln/fln mice gained weight more slowly than their littermate. ∗∗∗∗p < 0.0001, one way ANOVA test followed by Tukey’s multiple comparisons test.

