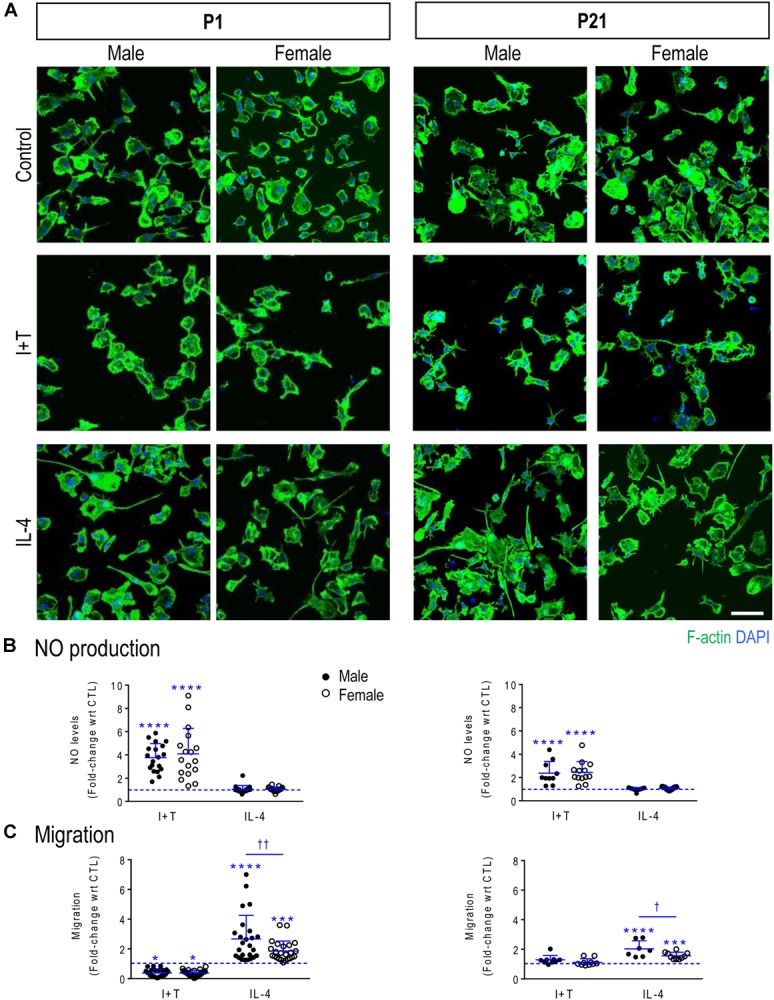
FIGURE 1.

Verifying that primary rat microglia responded to IFNγ + TNFα and to IL-4 at P1 and P21. Male and female neonatal (P1) and prepubertal (P21) microglia were sex-segregated (see Materials and Methods). (A) Representative fluorescence images of primary rat microglia (unstimulated, CTL) and 24 h after treatment with I+T or IL-4. Microglia were fixed and stained for F actin (phalloidin; green) and nuclei (DAPI; blue). Scale bar, 50 μm. (B) Cumulative NO production for the 24 h period after stimulation. Each circle represents an individual culture (closed, male; open, female). (C) The activation state differently affects migration of microglia at P1 and P21. All graphical results are expressed as fold changes normalized to unstimulated cells, which are indicated by dashed lines. Individual values are plotted, mean ± SD indicated, and differences shown are with respect to control microglia (∗) and between sexes (†). One symbol of either type indicates p < 0.05; two symbols, p < 0.01; three symbols, p < 0.001; four symbols, p < 0.0001.
