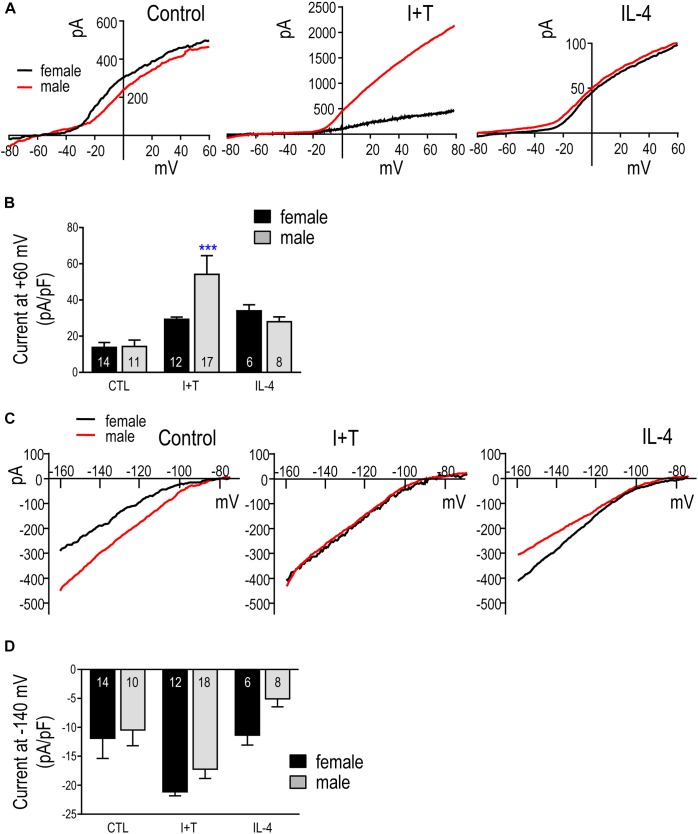
FIGURE 9.
Kv and Kir currents in prepubertal (P21) microglia. (A) Representative whole-cell outward-rectifying Kv currents from male and female P21 microglia at 24 h in untreated cells (control) or after treatment with I+T or IL-4. For each recording, the voltage was ramped to +40 mV from a holding potential of –110 mV. (B) Summary of Kv current density (pA/pF) measured at +40 mV. Graphical summaries in (B,D) show mean ± SEM for the number of replicates indicated on each bar; and were analyzed by two-way ANOVA and Bonferroni post hoc test. ∗∗∗p < 0.001 indicates a difference from the control current. (C) Representative inward-rectifier (Kir) currents at 24 h in untreated microglia (control) or after treatment with I+T or IL-4. From a holding potential of –110 mV, the voltage was ramped from –160 to –60 mV. (D) Summary of peak Kir inward current density (pA/pF) measured at –140 mV.

