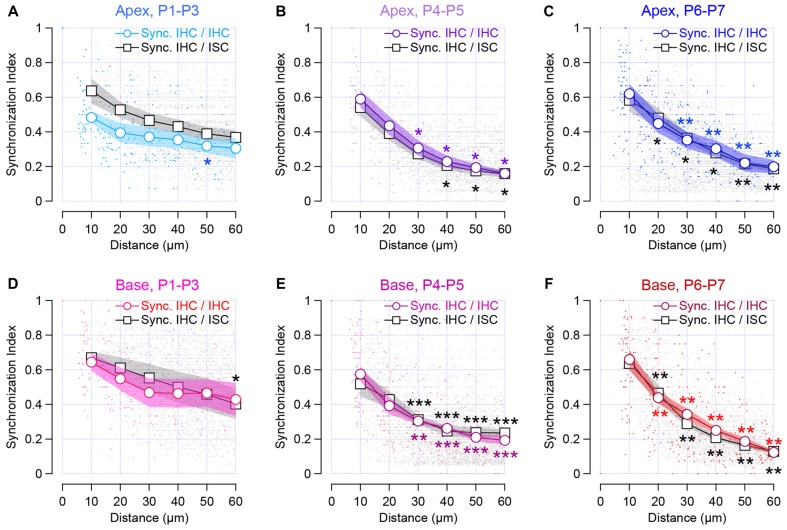
Figure 4.
Synchronous [Ca2+]i activity between neighboring sensory cells and non-sensory cells in the developing cochlea. The synchronous index is plot against the location of the cells. Colored symbols indicate the synchronized activity between neighboring IHCs in the apical (A–C) and basal cochlear turn (D–F). Black and gray symbols indicate synchronous activity between sensory cells and ISCs within the Kölliker’s organ. Lines with white circles show synchronized activity binned over 10 μm distance and dots show individual data set. Stars indicate the significant difference in comparison to SI at 10 μm distance. ***p < 0.001, **p < 0.01 and *p < 0.05. Number of cochleas examined: P1–P3 base: 5, P1–P3 apex: 4, P4–P5 base: 8, P4–P5 apex: 4, P6–P7 base: 6, P6–P7 apex: 7.

