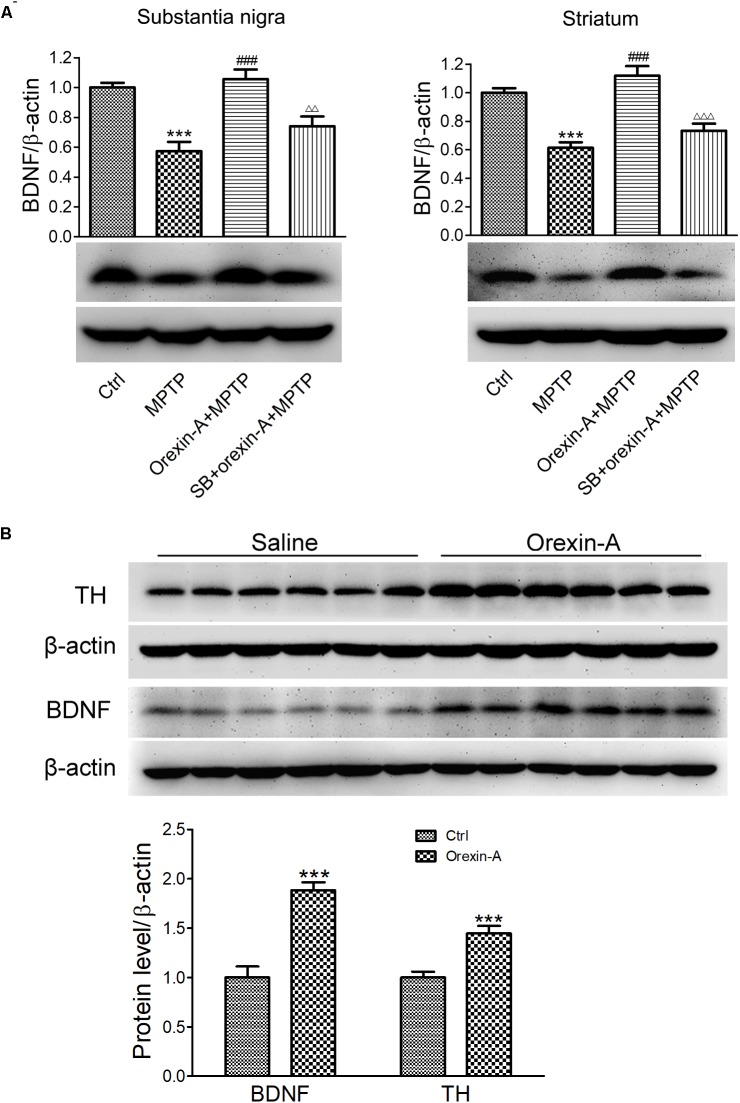
FIGURE 6.
Effects of orexin-A on the protein expression of BDNF. (A) Immunoblot analysis showing the protein expression of BDNF in the substantia nigra and striatum of MPTP parkinsonian mice. Average protein level was quantified as ratios between BDNF and β-actin. (B) Immunoblot analysis showing the effects of orexin-A on protein expression of BDNF in the striatum after 3 days of orexin-A injection in normal mice. Average protein level was quantified as ratios between BDNF or TH and β-actin. Each value represented mean ± SEM, n = 6. ∗∗∗P < 0.001 vs. control; ###P < 0.001 vs. MPTP; ΔΔ P < 0.01, ΔΔΔ P < 0.001 vs. orexin-A + MPTP. SB: SB334867.

