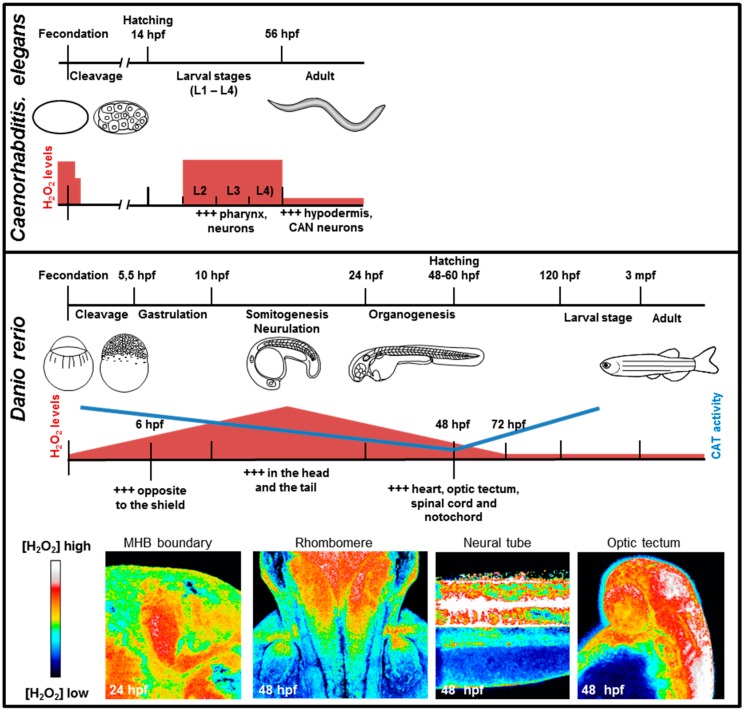
Figure 2.
H2O2 detection during development. Upper panel: H2O2 detection during C. elegans development. Adapted from [62] and [60]. Middle panel: H2O2 levels and catalase activity during Danio rerio development. Adapted from [61]. Lower panel: HyPer fish reveal spatio-temporal dynamic and gradients of H2O2 during neural development. hpf: hours post fertilization, mpf: month post fertilization.

