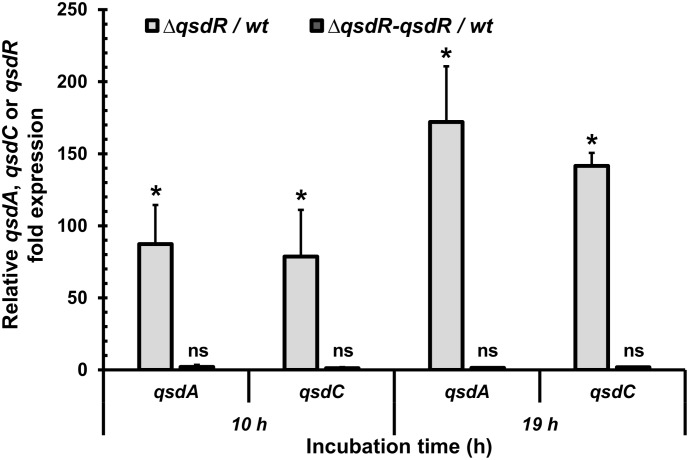
FIGURE 3.
Increased qsdA and qsdC mRNA levels in a ΔqsdR mutant strain. qRT-PCR analysis shows the qsdA and qsdC mRNA levels in the ΔqsdR mutant and in the complementing strain (ΔqsdR-qsdR) grown in 7H9 medium at the mid-exponential (10 h) and stationary (19 h) phases. These mRNA levels are relative to the wild type strain. Data shown are mean values obtained from three independent experiments. Statistical analysis was performed by the DataAssistTM software (v3.01) used for calculating relative quantitation of gene expression, based on the comparative CT (2-ΔΔCT) method. ∗p-value < 0.05; ns means no significant difference.

