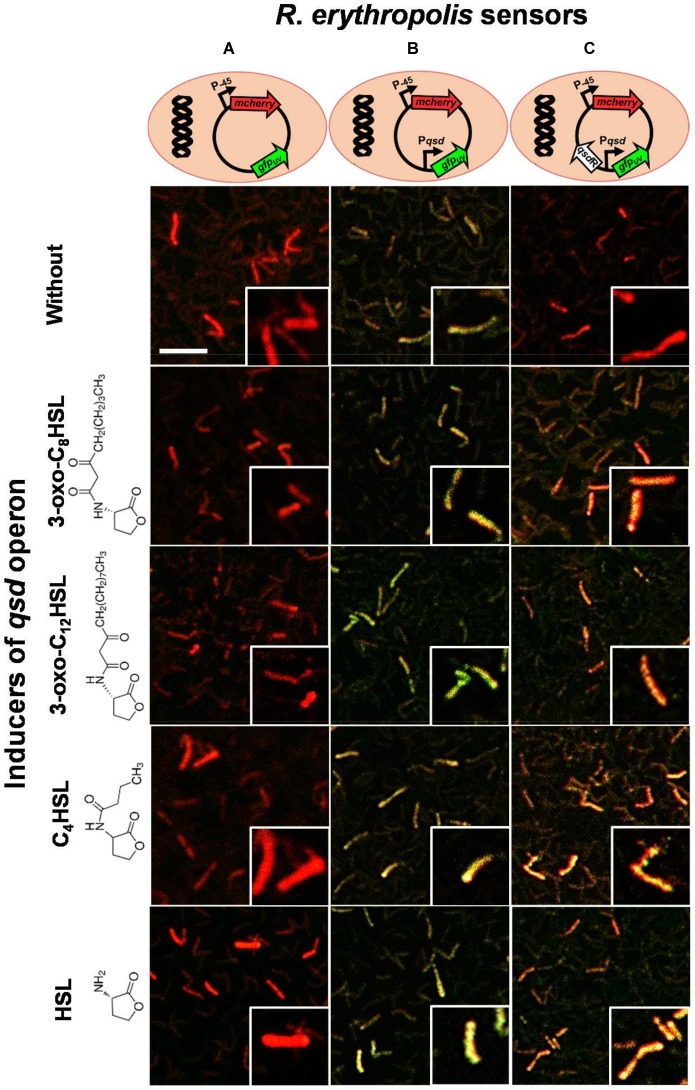
FIGURE 7.
Confocal microscopy analysis of the transcriptional activity of the qsd operon. Three dual-colored R. erythropolis R138 sensors were constructed using the pEPR1 vector containing a green fluorescent protein gene as reporter gene and a red fluorescent protein mcherry gene as a cell tag. These strains carry (A) the gfp gene without promoter (as a control), (B) the gfp gene under control of the qsd promoter, and (C) the gfp gene under control of the qsd promoter and QsdR regulator (mimicking the regulation system of qsd operon expression). Rhodococcal cells were cultured in hexanoate minimal medium and harvested every 2 h after the addition of one micromolar of 3-oxo-C8-HSL, 3-oxo-C12-HSL, C4-HSL, or HSL. Cultures in hexanoate without inducer were used as control. Map of each designed vector are schematized at the top of the figure and the structure of inducers with the common γ-lactone ring is drawn on the left of the figure. Fluorescence images were combined in the green and red channels (see section “Materials and Methods”), the co-expression of the two fluorescent proteins causing a yellow-greenish to amber fluorescence depending on the intensity of gfp expression. A close-up of some cells is proposed in a lower right window. Scale bar represents 10 μm.

