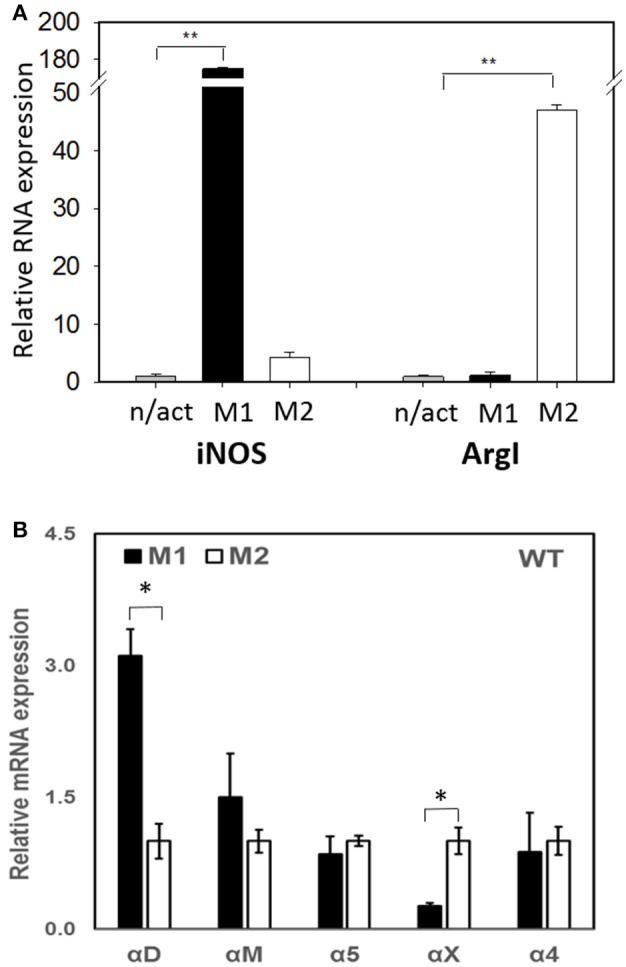
Figure 2.

(A) The expression of M1 (iNOS) and M2 (Arg I) markers on IFN-γ (M1) and IL-4 (M2) stimulated macrophages using Real Time-PCR. Statistical analyses were performed using paired Student t-tests (n = 3 per group). Data are presented as mean ± SEM. **P < 0.01, compared to non-activated (n/act). (B) The expression of fibrin-binding integrins during M1 and M2 polarization. Open bars—non-activated; black bars M1-polarized, gray bars M2-polarized macrophages. Statistical analyses were performed using Student's paired t-tests (non-activated to activated) (n = 3 per group). Data are presented as mean ± SEM. *P < 0.05.
