
Figure 5.
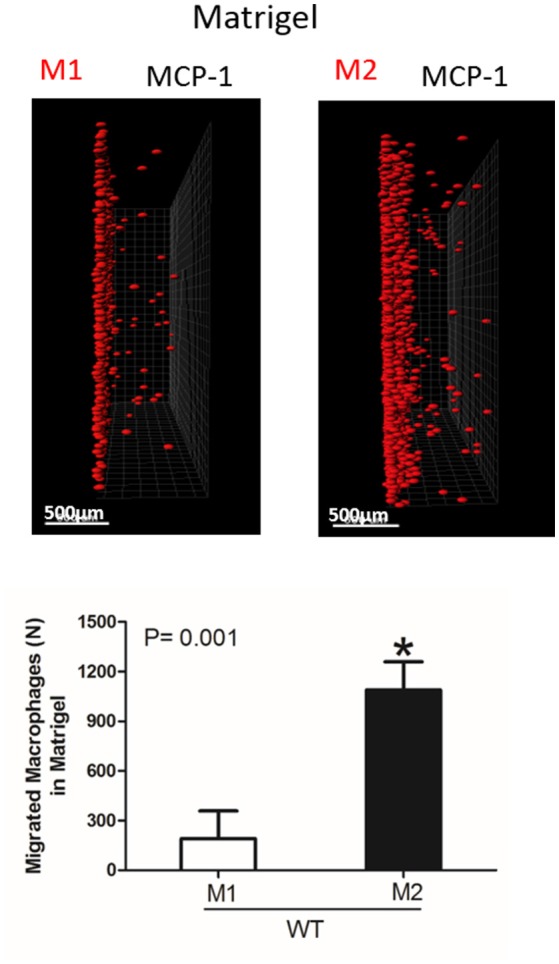
Migration of M1 and M2-activated macrophages in Matrigel. After 48 h, migrating cells were detected by a Leica Confocal microscope and the results were analyzed by IMARIS 8.0 software, scale bar= 500 μm. Statistical analyses were performed using Student's paired t-tests (n = 4 per group). Data are presented as mean ± SEM. *P < 0.05.