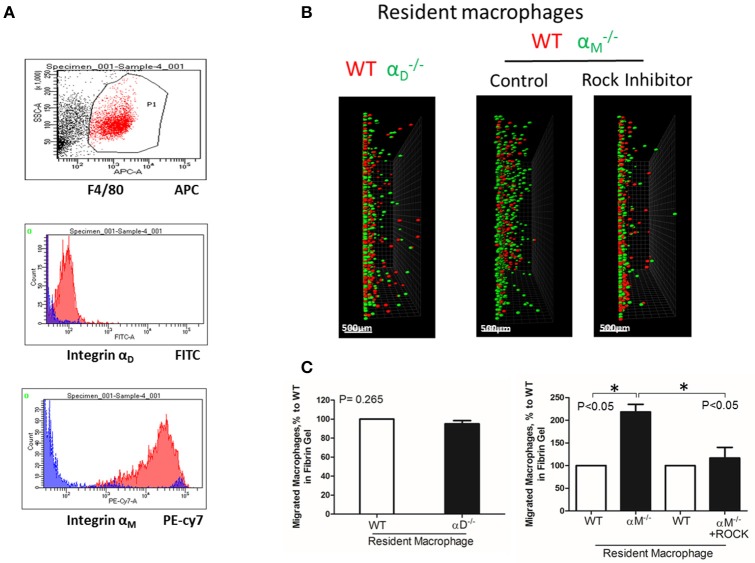
Figure 6.
A high expression of αM on resident macrophages reduces their amoeboid migration. (A) The expression of integrin αD and αM on resident macrophages was detected with anti-αD and anti-αM antibodies, respectively, and tested by flow cytometry analysis. (B) Migration of peritoneal resident macrophages in 3-D fibrin matrix. Migrating resident macrophages from WT and mice are shown in the left panel. The middle and right panels represent the migrating resident macrophages from WT and mice with or without Rock inhibitor (Y27632). Migrating cells were detected by a Leica Confocal microscope (Leica-TCS SP8). Scale bar = 500 μm. (C) The results were analyzed by IMARIS 8.0 software. Statistical analyses were performed using Student's paired t-tests (n = 4 per group). Data are presented as mean ± SEM. *P < 0.05.

