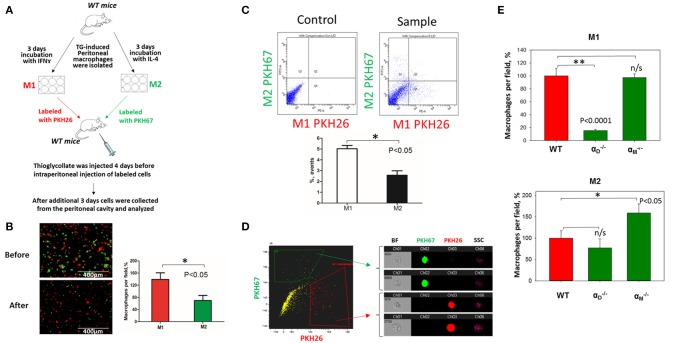
Figure 7.
In vivo migration of M1 and M2 macrophages confirmed the results of the 3D migration assays. (A) The model of in vivo resolution of peritoneal inflammation. Peritoneal macrophages were isolated from WT mice at 3 days after injection of thioglycollate (TG) and placed on petri dish for 3 days incubation with 100 U/ml IFNγ or 2nM IL-4 to generate M1 and M2 activated macrophages, respectively. Collected M1 and M2 macrophages were labeled with PKH26 or PKH67 fluorescent dyes. Labeled M1 and M2 macrophages were mixed in a 1:1 ratio and further injected intraperitoneally into WT mice with 4 days predisposed TG-induced peritoneal inflammation. (B) The equal ratio of red and green macrophages before the injection was verified by sample cytospin preparation (B, upper panel). 3 days later, peritoneal macrophages were harvested, and the percentages of red and green fluorescent macrophages were assessed by cytospin (B, lower panel) and flow cytometry (C,D). The quantification of the data was analyzed by using Image Analysis Software (EVOS, Thermo Fisher) at least 4 fields of view per sample (n = 4) (B, right panel). (C) Flow cytometry. Live isolated cells were selected with live/dead kit and analyzed using 488 and 567 channels (Fortessa X-20). The results were analyzed with Diva software and statistical analysis was performed using Student's t-test. Data are presented as mean ± SEM. *P < 0.05. (D) Imaging flow cytometer. The population of single, alive cells was analyzed on red and green channels and individual cells were evaluated in green and red positive areas (ImageStream Mark II, Amnis). Channel 1- Brightfield (BF). Channel 2- 488 wavelength (PKH67). Channel 3−566 wavelength (PKH26), channel 6—side scattering (SSC). (E) M1- and M2-activated macrophages in the peritoneal cavity during the resolution of peritoneal inflammation. The quantification of the data was analyzed by using Image Analysis Software (EVOS, Thermo Fisher) 4–6 fields of view per sample (n = 4). Data are presented as mean ± SEM. *P < 0.05.

