Figure 3.
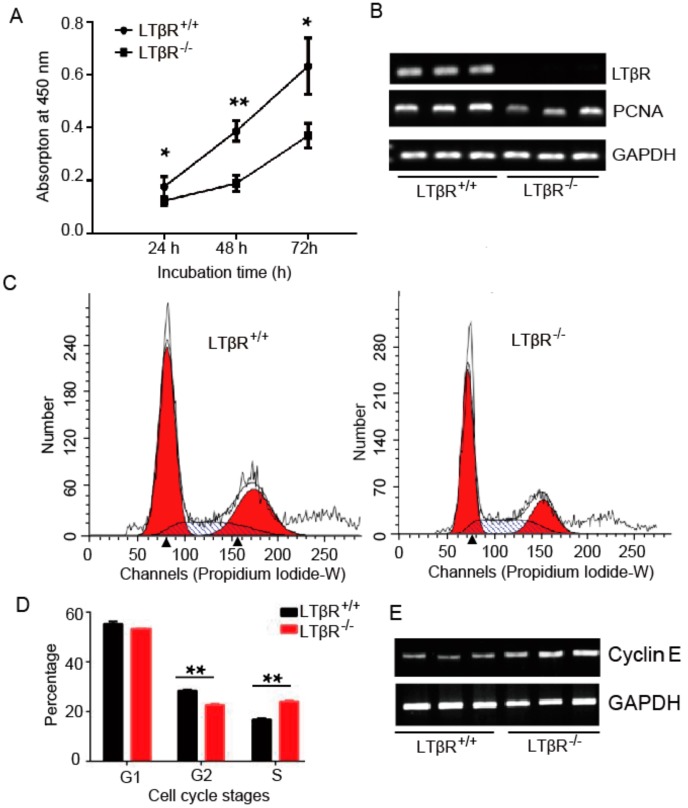
The effect of LTβR on IPEC-J2 cell proliferation and cell cycle progression. (A) LTβR+/+ and LTβR−/− cells were plated and cultured for various times, and the number of proliferating cells was quantified by the Cell Counting Kit-8 (CCK-8) method. The results shown are representative of three different experiments * p < 0.05 and ** p < 0.01. (B) Semi-quantitative PCR of LTβR and proliferating cell nuclear antigen (PCNA) in both cells. (C) LTβR+/+ and LTβR−/− cells were serum-starved for 24 h and stimulated with serum. After 24 h, the DNA content of incorporated propidium iodide was scanned on a flow cytometer. Each scan is derived from a representative experiment, where the data from at least 10,000 events were obtained. (D) Cell populations in G1, S, and G2 were determined using ModFit software (BD Biosciences, San Diego, CA, USA), ** p < 0.01. (E) Semi-quantitative PCR of Cyclin E in both cells.

