Figure 4.
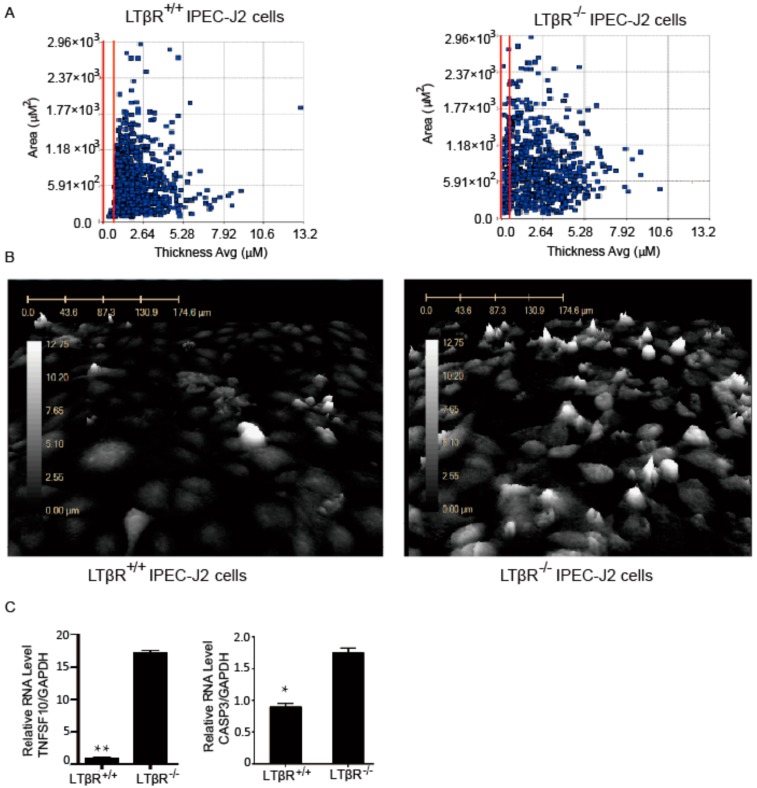
The effect of LTβR on IPEC-J2 apoptosis. LTβR+/+ and LTβR−/− cells were seeded into 6-well plates, and apoptosis was monitored for 72 h by HoloMonitor®M4 microscopy. (A) Dot plot of LTβR+/+ and LTβR−/− IPEC-J2 cells after 72 h culture. The x-axis is the average thickness (µM) of the cells, and the y-axis presents the surface area of the cells (µM2). Apoptotic cells with lower thickness and higher surface area are between the red lines. Note there are almost no apoptotic cells between the red lines for the LTβR+/+ group (left), while significantly more apoptotic cells are found in the LTβR−/− cell population (right). (B) Three-dimensional structures of living LTβR+/+ (left) and LTβR−/− (right) cells after 72 h. The number of tall cells is noticeably increased in LTβR−/− cells. (C) Real-time PCR data of TNF superfamily member 10 (TNFSF10) and Caspase 3 (CASP3) in LTβR+/+ and LTβR−/− cells, * p < 0.05 and ** p < 0.01.

