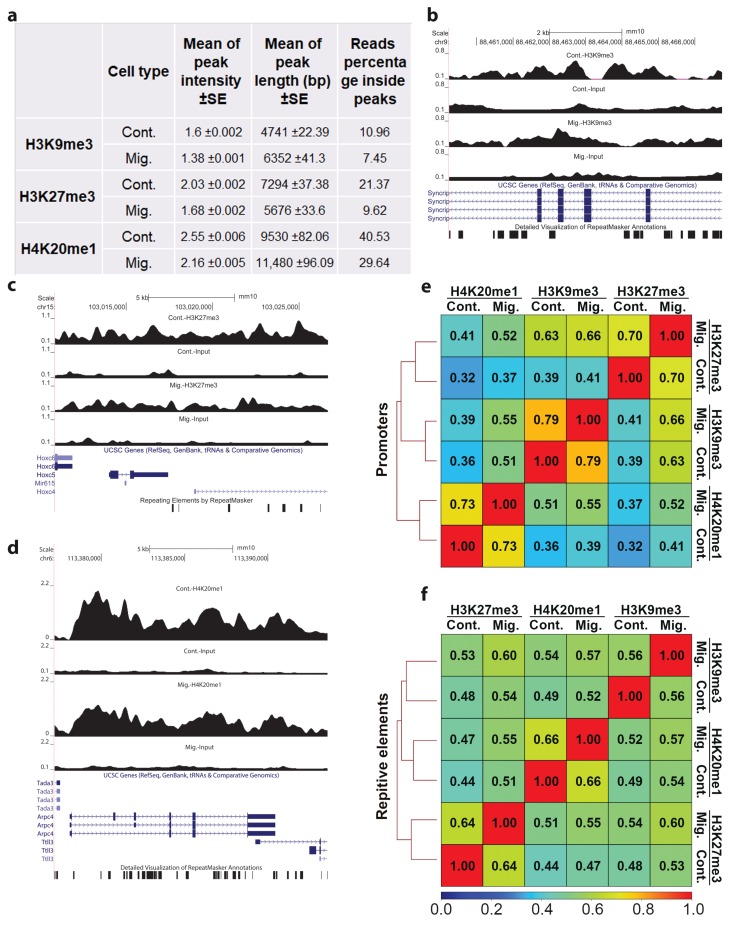
Figure 1.
The patterns of the ChIP-seq signals of H3K9me3, H3K27me3, and H4K20me1 upon induction of migration. (a) Mean ± SE of ChIP-seq peak intensities and lengths of H3K9me3, H3K27me3, and H4K20me1 in control (Cont.) and migrating (Mig.) cells. Reads percentage inside peaks are the percentages of ChIP-seq mapped reads of the indicated heterochromatin markers that are localized inside peaks. Statistical significance was calculated between control cells to migrating cells by Wilcoxon rank sum test, p < 2.2 × 10⁻¹⁶. (b–d) UCSC browser shots of H3K9me3, H3K27me3, and H4K20me1, respectively. (e,f) Correlation between the three heterochromatin markers over promoters and repetitive elements. Spearman correlation coefficients of the ChIP-seq signals were calculated from reads coverage of consecutively equally sized 10 kb bins.

